Interventions Incidence Screen
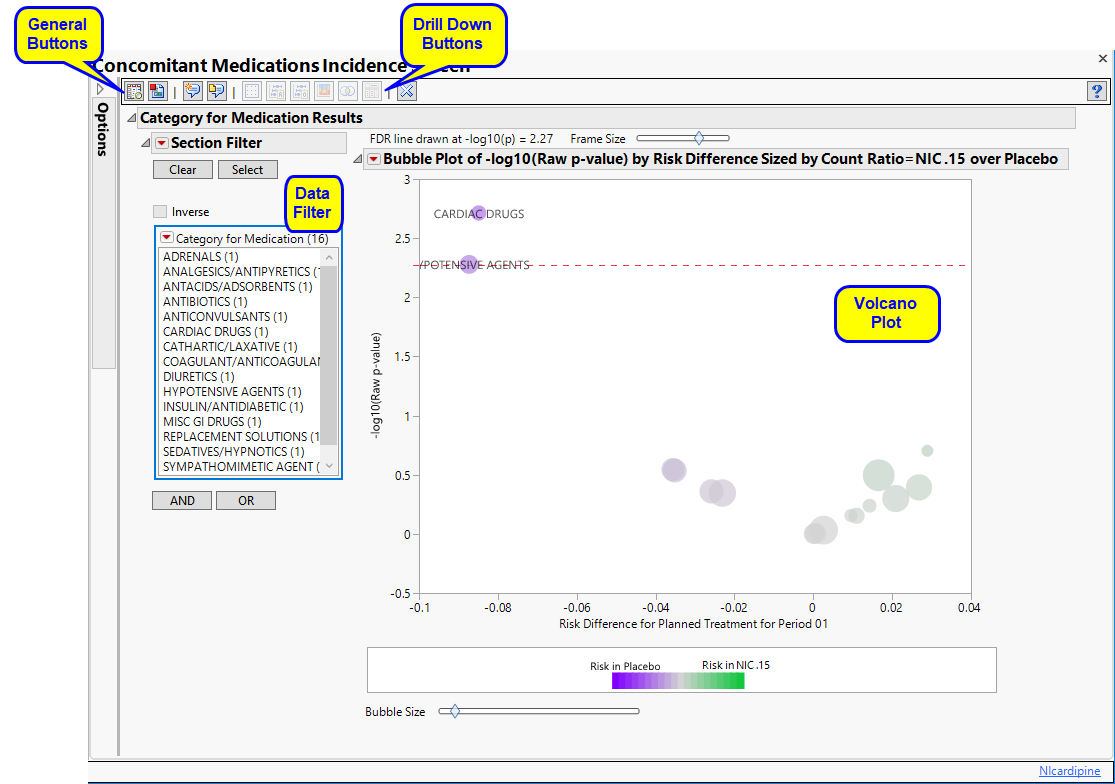
This report screens all interventions by performing a Cochran-Mantel-Haenszel exact test on all 2 x 2 tables constructed from intervention (e.g. Concomitant Medications, Substance Use) incidence and treatment arm. Output includes one or more volcano plots of risk differences when using default settings. However, plots of relative risks or odds ratios can be generated depending on the selected option for the x-Axis for Volcano Plot.
Report Results Description
Running this report for Nicardipine using default settings generates the report shown below.
Refer to the Adverse Events Incidence Screen , keeping in mind the following important differences in contrast with the example:
| • | Output (including section names) reflects intervention incidence corresponding to selected domain (e.g. Concomitant Medication, Substance Use), rather than adverse events, incidence |
| • | Term Level is allowed to equal Category (such as CMCAT or SUCAT, depending on the domain) |
Refer to Confidence Intervals for information on how JMP Clinical calculates and uses confidence intervals.
Note: The following notes: Multiple treatment periods have been detected and displayed. and Pre-treatment has been assigned to period=0. are inserted at the top of the report when these events are detected in your data.
Report Options
Domain
Use the Domain option to specify whether to examine results in Concomitant Medications (CM), Exposure (EX), Exposure as Collected (EC), Procedures (PR), or Substance Use (SU) interventions.
Term Level
Terms are determined by the coding dictionary for the Intervention domain of interest, typically these levels follow the MedDRA dictionary. You must indicate how each event is named and the level at which the event is considered. For example, selecting Reported Name reports the event specified by the actual event term as reported in the specified domain.
See Term Level for additional information.
Treatment or Comparison Variable:
The primary goal of clinical trials is to distinguish treatment effects when reporting and analyzing trial results. Treatments are defined by specific values in the treatment or comparison variables of the CDISC models. These variables are specified in this report using the Treatment or Comparison Variable to Use andTreatment or Comparison Variable options.
Distributions of the specified treatment or comparison variables are shown in the output.
Available variables include Planned, which is selected when the treatments patients received exactly match what was planned and Actual, which is selected when treatment deviates from what was planned.
You can also specify a variable other than the ARM or TRTxxP (planned treatment) or ACTARM or TRTxxA (actual treatment) from the CDISC models as a surrogate variable to serve as a comparator. Finally you can select None to plot the data without segregating it by a treatment variable.
See Treatment or Comparison Variable to Use, Treatment or Comparison Variable for more information.
Interventions to Consider
By default, all interventions are included in the analysis. Analysis can consider all events or only those that emerge at specific times before, during, or after the trial period. For example, selecting On treatment events as the Intervention Type includes only those events that occur on or after the first dose of study drug and at or before the last dose of drug (+ the offset for end of dosing).
If you choose to Ignore available treatment emergent flags, the analysis includes all adverse events that occur on or after day 1 of the study.
When the end of treatment date is not known, check the Treatment end date is equivalent to the start date box to use the treatment start date to impute treatment end date, implying all treatment doses start and end the same day.
Filtering the Data:
Filters enable you to restrict the analysis to a specific subset of subjects and/or interventions, based on values within variables. You can also filter based on population flags (Safety is selected by default) within the study data.
If there is a supplemental domain (SUPPCM or SUPPEX) associated with your study, you can opt to merge the non-standard data contained therein into your data.
See Select the analysis population, Select saved subject filter1, Merge supplemental domain, Filter to Include Interventions, and Additional Filter to Include Subjects2 or more information.
Model
The Treatment Control Level is specified as either “Placebo” or “Pbo”, depending on the value found in your data, by default. However, if your control is defined differently you can use the text box to specify the control level is identified in your study.
You can opt to assess interventions across the entire study (specified by default). Alternatively, you can use the Trial Time Windows option to limit it to selected time points or intervals. By default, time is measured in days. However, you can change the Time Scale to measure time in weeks. This option is useful for assessing report graphics for exceptionally long studies.
You can also subdivide the subjects and run analyses for distinct groups by specifying one or more By Variables.
Stratification Variables segment the data into meaningful clusters and statistical tests such as the CMH exact test account for them. Such stratification is usually recommended when strata exist in your study, for example, by site.
Multiple Testing Adjustment Options
Multiple testing adjustments enable you to control both the proportion of all truly null hypothesis tests that are claimed to be significant (false positive rate) and the proportion of hypothesis tests claimed significant that are truly null (false discovery rate) for conclusions drawn across a collection of statistical tests.
You can opt to Perform Double FDR Adjustment on your data. By default, this adjustment is not performed. The Double False Discovery Rate method3 is used here to compare the incidence of interventions among treatments, leveraging the grouping of related events (typically defined by the MedDRA system organ class). The method considers whether related terms within a group show differences between the treatments and upweights or downweights the significance of an individual term within the group accordingly.
Group Levels specify how to define groups for the Double FDR Adjustment.
The False Discovery Rate test is selected by default. You can use the Multiple Testing Method option to select alternative test protocols.
The Alpha option is used to specify the significance level by which to judge the validity of the model generated by this report. The meaning of alpha depends on the adjustment method that you select. Alpha can be set to any number between 0 and 1, but is most typically set at 0.001, 0.01, 0.05, or 0.10. The higher the alpha, the higher the error rate but also higher the power for detecting significant differences. You will need to decide on the best trade-off for your experiment.
Note that instead of performing multiple testing adjustments of the p-values, you can opt to simply specify a cutoff value for -log10(p-values) in order to select significant hypothesis tests. Using unadjusted p-values with a cutoff has the benefit of more expansive volcano plots, whereas adjusted p-values tend to squish points along the y-axis.Refer to -log10(p-Value) Cutoff for more information. Note: This option is available only when no multiple testing method is specified.
Results
Use the x-Axis for Volcano Plot option to specify the parameter to be plotted on the x-axis of your volcano plots. The Color Theme option enables you to specify the color scheme of the report graphics.