Caption Box
The Caption Box element ![]() displays a summary statistic value on the plot. The summary statistic corresponds to the variable that corresponds to the axis that you specify as the Response Axis in the Caption Box options.
displays a summary statistic value on the plot. The summary statistic corresponds to the variable that corresponds to the axis that you specify as the Response Axis in the Caption Box options.
Summary Statistic for Categorical Variables
For a categorical variable, the Summary Statistic that appears is calculated by assigning numerical values to the levels of the categorical variable. The levels are placed in the order defined by their value ordering. They are assigned integer values ranging from 0 to the number of levels minus one.
Note: When using categorical values in zones associated with summarization roles like Y and Color, summary statistics are calculated based on numerical values assigned to the variable levels. (The integer values range from 0 to the number of levels minus one.) The final result is then mapped back as a level to a corresponding categorical value or value range. This approach allows the use of ordinal variables in summarization, but might not lead to clear results for nominal variables.
For an example illustrating the Caption Box element, see Example of Features in Graph Builder.
Figure 3.39 Caption Box Options
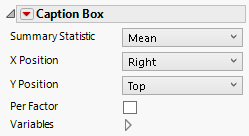
Summary Statistic
Specifies the summary statistic to be displayed for the variable defined by the Response Axis setting. The default Summary Statistic is the Mean. For more information about how summary statistics are computed for categorical variables, see Summary Statistic for Categorical Variables.
X Position
Specifies the horizontal position of the caption.
Y Position
Specifies the vertical position of the caption.
Per Factor
Shows a caption for each X, or each Y if horizontal.
Variables
Shows or hides graph elements for variables, or re-orders the display of variables.
Note: These options do not apply to variables in the Group X, Group Y, Wrap, or Page zones.
Check boxes are followed by the zone designation and the name of the variable. Use check boxes to do the following:
– Show or hide the elements corresponding to a variable in a zone.
– Add or remove the effect of applying the Color, Size, Shape, or Freq variable to the variable in the zone.
Tip: If you have multiple graphs, you can color or size each graph by different variables. Drag a second variable to the Color or Size zone, and drop it in a corner. In the Variables option, select the specific color or size variable to apply to each graph.
Use arrows to re-order the display if there are multiple variables in a zone. Highlight a variable name and click an arrow to reposition it.
Red Triangle Options for Caption Box
Response Axis
Specifies the axis for the variable whose summary statistic is displayed. The Y axis is the default. Notice that this axis can differ from the Response Axis specified to define the plot.