Publication date: 07/30/2020
Maps
Add Maps or Custom Shapes to Enhance Data Visualization
JMP transforms numbers and geographic data into compelling images, and turns simple tables of numbers into captivating pictures that bring the story in your data to life. JMP can help you display your data on geographical maps. Choose from built-in high-quality images. Select Street Map Service or Web Map Service to get custom map images from the Internet. JMP includes shape files for borders or many geographic regions and lets you add your own custom shapes, such as for a manufacturing plant or campus.
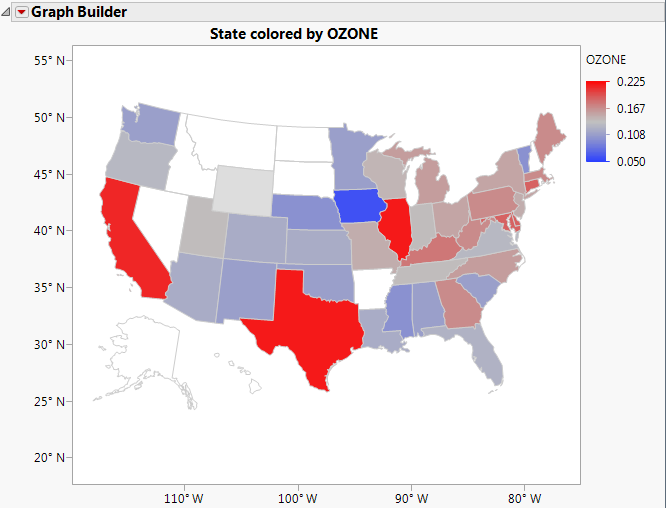
Figure 12.1 Example of a Map
Contents
Overview of Mapping
Example of Creating a Map in Graph Builder
Graph Builder
Map Shape
Color
Size
Custom Map Files
Background Maps
Images in Maps
Boundaries
Examples of Creating Maps
Louisiana Parishes Example
Hurricane Tracking Examples
Office Temperature Study
Boundary Map with Clipped Elements
Want more information? Have questions? Get answers in the JMP User Community (community.jmp.com).