Mosaic
The Mosaic element ![]() uses rectangle sizes to represent the proportion of observations in categories for one variable across categories of another variable. Although variables can be categorical or continuous, they are treated as categorical. For more information about mosaic plots, see Mosaic Plot in Basic Analysis.
uses rectangle sizes to represent the proportion of observations in categories for one variable across categories of another variable. Although variables can be categorical or continuous, they are treated as categorical. For more information about mosaic plots, see Mosaic Plot in Basic Analysis.
The default Response Axis is the Y axis. This means that, for each level of the X variable, vertical stacked bars show the proportion of values in each level of the Y variable. You can change the primary direction of the graph to X (horizontal).
Note: The plot is not affected in any way if rows are hidden and not excluded.
For an example illustrating the Mosaic element, see Example of a Mosaic Plot in the Graph Builder Examples section.
Figure 3.38 Mosaic Options
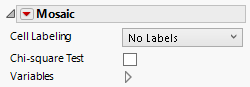
Cell Labeling
Add labels to cells based on counts, percents, and so on.
Chi-square Test
Performs a Pearson chi-square test and shows results in a label on the graph. This option appears if each side has 2 or more levels.
Variables
Shows or hides graph elements for variables, or re-orders the display of variables.
Note: These options do not apply to variables in the Group X, Group Y, Wrap, or Page zones.
Check boxes are followed by the zone designation and the name of the variable. Use check boxes to do the following:
– Show or hide the elements corresponding to a variable in a zone.
– Add or remove the effect of applying the Color, Size, Shape, or Freq variable to the variable in the zone.
Tip: If you have multiple graphs, you can color or size each graph by different variables. Drag a second variable to the Color or Size zone, and drop it in a corner. In the Variables option, select the specific color or size variable to apply to each graph.
Use arrows to re-order the display if there are multiple variables in a zone. Highlight a variable name and click an arrow to reposition it.
Red Triangle Options for Mosaic
Response Axis
Changes the axis that is associated with the response variable to X (horizontal), Y (vertical), or Auto (the Y axis for Mosaic). The variable on the Response Axis is used to calculate the proportion of observations in each level of the variable on the other axis.