Publication date: 07/30/2020
The Fit Life by X Report
The initial report window includes the following sections:
Distribution, Quantile, Hazard, Density, and Acceleration Factor profilers, along with criteria values under Comparison Criterion can be viewed and compared.
• Results
Parametric estimates, covariance matrices, nested model tests, and diagnostics can be examined and compared for each of the selected distributions. You can also perform custom estimation and obtain Bayesian estimates for the distribution parameters.
Summary of Data
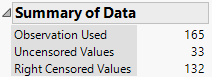
The Summary of Data section gives the total number of observations, the number of uncensored values, and the number of censored values (right, left, and interval). Figure 4.5 shows the summary data for the Devalt.jmp sample data table.
Figure 4.5 Summary of Data Example
Want more information? Have questions? Get answers in the JMP User Community (community.jmp.com).