Treemap
The Treemap element ![]() shows the levels or values of a variable as rectangles within a rectangular display. The rectangle sizes represent summary statistic values of the variable in the Y zone across the levels or values of one or more X variables. The rectangles are sized to represent the values of the summary statistic without leaving unused space in the overall rectangular layout.
shows the levels or values of a variable as rectangles within a rectangular display. The rectangle sizes represent summary statistic values of the variable in the Y zone across the levels or values of one or more X variables. The rectangles are sized to represent the values of the summary statistic without leaving unused space in the overall rectangular layout.
To construct a treemap that shows summary values across the levels of two or more X variables, merge the variables in the X zone.
Note: The plot is not affected in any way if rows are hidden and not excluded.
For an example illustrating the Treemap element, see Example of a Treemap in the Graph Builder Examples section.
Figure 3.37 Treemap Options
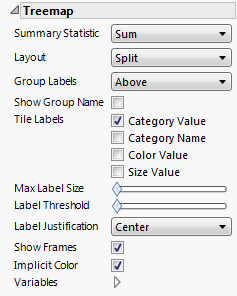
Note: Some of these options are specific to Graph Builder and are not available in the Treemap platform.
Summary Statistic
Specifies the summary statistic, corresponding to the variable in the Y zone, that is used to size the rectangles.
Layout
Arranges rectangles to the extent possible by the value ordering of the X variable or by the size of the rectangle.
Split
Arranges the rectangles according to the value ordering of the levels or values of the X variable. Split is the default setting.
Squarify
Arranges the rectangles according to the values of the summary statistic, sorted in descending order. This places the largest rectangles in the top left corner of the plot and the smallest in the bottom right corner.
Mixed
Applies only when you have two or more X variables. It applies Split to the outermost variable and Squarify to the other variables. It follows that the large groupings are ordered according to their value ordering, whereas the inscribed rectangles are ordered according to the summary statistic values.
Group Labels
When you have more than one X variable, show the additional group labels above each category, or floating (default) in the center of each category. You can also remove group labels.
Tip: To filter data in a group, click a group label.
Show Group Name
Adds the variable title to the group labels.
Tile Labels
Shows or hides the following labels:
Category Value
The values of the X variable.
Category Name
The name of the X variable.
Color Value
The values of the Color variable.
Size Value
The values of the Size variable, or the Y variable if no Size variable exists (Size Value).
Tip: Place your cursor over a rectangle to see details.
Max Label Size
Increases or decreases the size of the labels.
Label Threshold
Removes labels based on the size of the rectangle. By default, all labels are shown. Move the slider to the right to remove labels for progressively larger rectangles.
Label Justification
Places the label in the center, left, or right.
Show Frames
Shows or hides the borders around the rectangles.
Tip: Use the treemap option in the right-click customize menu to adjust frame color, style, and thickness.
Implicit Color
Shows or hides the color. If no variable is specified in the Color zone, all rectangles have the same color.
Variables
Shows or hides graph elements for variables, or re-orders the display of variables.
Note: These options do not apply to variables in the Group X, Group Y, Wrap, or Page zones.
Check boxes are followed by the zone designation and the name of the variable. Use check boxes to do the following:
– Show or hide the elements corresponding to a variable in a zone.
– Add or remove the effect of applying the Color, Size, Shape, or Freq variable to the variable in the zone.
Tip: If you have multiple graphs, you can color or size each graph by different variables. Drag a second variable to the Color or Size zone, and drop it in a corner. In the Variables option, select the specific color or size variable to apply to each graph.
Use arrows to re-order the display if there are multiple variables in a zone. Highlight a variable name and click an arrow to reposition it.