Histograms
Histograms visually display your data. For categorical (nominal or ordinal) variables, the histogram shows a bar for each level of the ordinal or nominal variable. For continuous variables, the histogram shows a bar for grouped values of the continuous variable.
Highlighting data
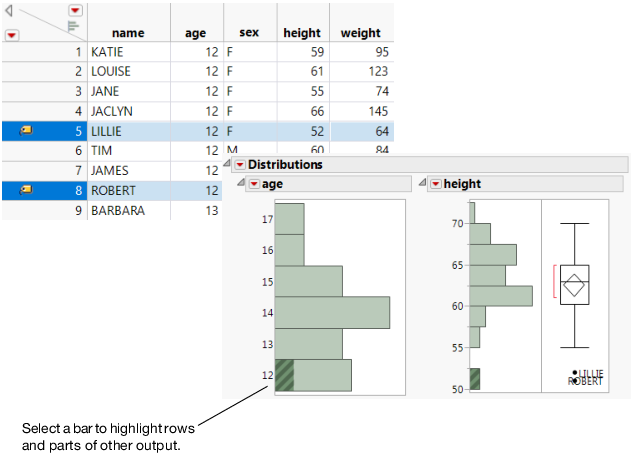
Click a histogram bar or an outlying point in the graph. The corresponding rows are highlighted in the data table, and corresponding sections of other histograms are also highlighted, if applicable. See Highlight Bars and Select Rows.
Creating a subset
Double-click a histogram bar, or right-click a histogram bar and select Subset. A new data table that contains only the selected data is created.
Resizing the entire histogram
Place your cursor over the histogram borders until you see a double-sided arrow. Then click and drag the borders.
Rescaling the axis
Click and drag on an axis to rescale it.
Alternatively, place your cursor over the axis until you see a hand. Then, double-click the axis and set the parameters in the Axis Settings window.
Resizing histogram bars
(Available only for continuous variables.) There are multiple options to resize histogram bars. See Resize Histogram Bars for Continuous Variables.
Specifying your selection
Specify the data that you select in multiple histograms. See Specify Your Selection in Multiple Histograms.
To see additional options for the histogram or the associated data table:
• Right-click a histogram. See Using JMP.
• Right-click an axis. You can add a label or modify the axis. See Customize Axes and Axis Labels in the Axis Settings Window and Add and Remove Axis Labels in Using JMP.
• Click the red triangle next to the variable, and select Histogram Options. Options are slightly different depending on the variable modeling type. See Options for Categorical Variables or Options for Continuous Variables.
Resize Histogram Bars for Continuous Variables
Resize histogram bars for continuous variables by using the following:
• the Grabber (hand) tool
• the Set Bin Width option
• the Increment option
Use the Grabber Tool
The Grabber tool is a quick way to explore your data.
1. Select Tools > Grabber.
Note: (Windows only) To see the menu bar, you might need to place your cursor over the bar below the window title. You can also change this setting in File > Preferences > Windows Specific.
2. Place the grabber tool anywhere in the histogram.
3. Click and drag the histogram bars.
Think of each bar as a bin that holds a number of observations. For vertical histograms:
• Moving the hand to the left increases the bin width and combines intervals. The number of bars decreases as the bar size increases.
• Moving the hand to the right decreases the bin width, producing more bars.
• Moving the hand up or down shifts the bin locations on the axis, which changes the contents and size of each bin.
Note: If you have changed the histogram orientation to horizontal, reverse these directions. Move the hand down to increase bin width, up to decrease bin width, and left or right to shift bin locations on the axis.
Use the Set Bin Width Option
The Set Bin Width option is a more precise way to set the width for all bars in a histogram. To use the Set Bin Width option, from the red triangle menu for the variable, select Histogram Options > Set Bin Width. Change the bin width value.
Use the Increment Option
The Increment option is another precise way to set the bar width. To use the Increment option, double-click the axis, and change the Increment value.
Highlight Bars and Select Rows
Clicking on a histogram bar highlights the bar and selects the corresponding rows in the data table. The appropriate portions of all other graphical displays also highlight the selection. Figure 3.6 shows the results of highlighting a bar in the height histogram. The corresponding rows are selected in the data table.
Tip: To deselect specific histogram bars, press the Control key and click the highlighted bars.
Figure 3.6 Highlighting Bars and Rows
Specify Your Selection in Multiple Histograms
Extend or narrow your selection in histograms as follows:
• To extend your selection, hold down the Shift key and select another bar. This is the equivalent of using an or operator.
• To narrow your selection, hold down the Control and Alt keys (Windows) or Command and Option keys (macOS) and select another bar. This is the equivalent of using an and operator.
For an example, see Example of Selecting Data in Multiple Histograms.