Red Triangle Options for the Data Filter
The red triangle menu next to Data Filter contains the following options:
Auto clear
If you have more than one nominal or ordinal column selected in the Data Filter, this option clears any other selections before making a new selection. For example, using Big Class.jmp, suppose that you have the columns sex (nominal) and age (ordinal) in your Data Filter. If you have males (M) selected for sex, and you click an age group, say age 12, your selection of males will be automatically cleared. This means that selecting age 12 is not conditional on selecting males. Conversely, if you turn off Auto clear, you can then select both males and age 12 at the same time. Auto clear is on by default.
Conditional
Limits the categories displayed for the selected filter column. See Conditional Data Filters.
Grouped by AND
Enables you to control the AND and OR behavior of multiple groups of column filters. See Grouped by AND in Data Filters.
Show Histograms and Bars
Displays the histogram and bars in the data filter.
Use Floating Window
Keeps the Data Filter window on top of its associated data table. If you do not want the Data Filter window to remain on top, deselect this option.
Start Over
Closes the current Data Filter session and shows the original Data Filter window.
Animation
Sequentially highlights the values of a single variable in the data table. See Animation in Data Filters.
Subset
Creates a new data table that contains only the following:
– The rows identified by the Data Filter.
– The columns selected in the active data table. If no columns are selected, then all columns are included.
This option is similar to the Tables > Subset command, only without subsetting options.
Save Where Clause
Builds a Where clause based on the value selections that you make.
Tip: Selecting To Formula Column creates an indicator column. You can use the indicator column in many platforms as a By role, Group or ID in Graph Builder, and so on.
Save Script
Provides options for saving scripts. See Save Script Menus.
Conditional Data Filters
For filter columns with hierarchy, you can use the Conditional option to filter what appears in the column lists. For example, you could filter by region so that only the states in the selected region appear in the list.
Note: If there is more than one OR group, the conditional filter is not available.
The following example illustrates how the Conditional option helps show the subcategories clearly, without the extra categories that do not belong.
1. Select Help > Sample Data Library and open Cities.jmp.
2. Select Rows > Data Filter.
3. In the Data Filter window, select city, State, and Region, and then click Add.
The Data Filter window appears, showing a list for each variable.
4. Click the Data Filter red triangle and select Conditional.
5. Select MW in the Region list.
6. Select OH from the State list.
The cities that are in Ohio and in the Midwest region are selected in the data table. In the Data Filter window, only Midwestern states appear in the State list, and only cities in Ohio appear in the cities list.
Figure 9.11 Using the Conditional Option
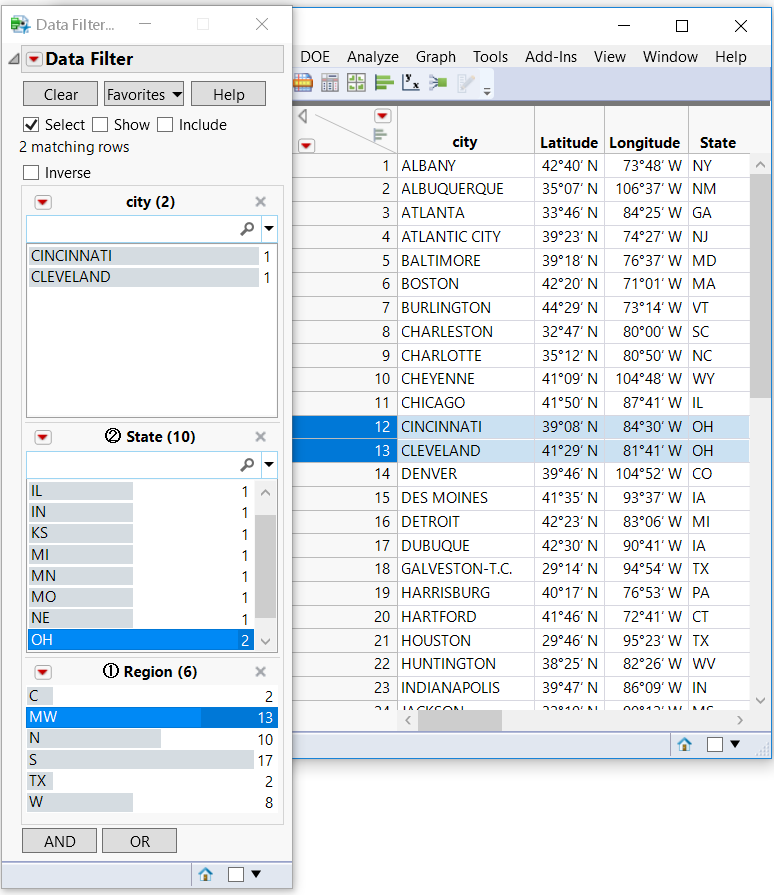
The bracketed number in front of the column name indicates the order in which the column values were selected. In Figure 9.11, Region was selected first, so it has a [1] in front of the column name. State was selected second, so it has a [2] in front of the column name.
When you rearrange hierarchical filters that are in ascending order, the filter number changes to match the ascending position in the hierarchy.
To clear the selections and reset the order of the hierarchy, click Clear.
Grouped by AND in Data Filters
When you add a filter column, click AND, and add another filter column, you create a filter group. Within that group, columns that meet all criteria are selected in the data table.
When you then click OR and add one or more filters, you create a second filter group. With Grouped by AND deselected, this is the default behavior.
If you select Grouped by AND, you reverse the behavior.
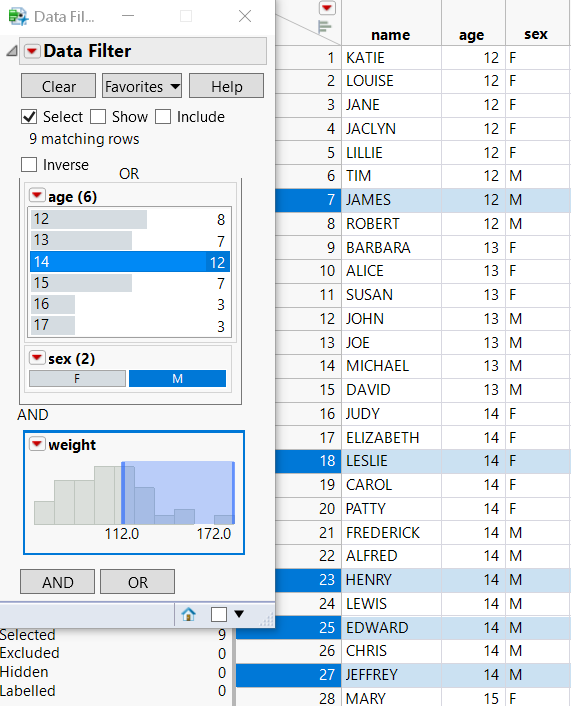
The following example shows what happens when Grouped by AND is selected.
1. Select Help > Sample Data Library and open Big Class.jmp.
2. Select Rows > Data Filter.
3. Click the Data Filter red triangle and select Grouped By AND.
4. In the Data Filter window, select the age column and click Add.
5. Click OR and add the sex column.
sex is added to the same group as age.
6. Hold down the Ctrl key, select 14 from the age filter, and select M from the sex filter.
age and sex are in the same group. In the data table, rows that meet either the age OR sex conditions are selected. That is, all 14-year-olds and all males are selected in the data table.
7. Click AND and add the weight column.
A new group is added.
8. Move the left weight slider to approximately 112.
Another filter group has been added. The second filter group limits the selection to those rows where weight is greater than 112.
The two filter groups together select rows that satisfy the condition in the first group AND the condition in the second group, that is, a student who is 14 or any male but must weigh more than 112.
Figure 9.12 Data Filter with Grouped by AND Condition