Update Hover Label Grid Entries
When you place your pointer over an element in a graph (such as a point, bar, and so on), you see content in the hover label for that element. By default, the hover label contains name and value pairs that are in a grid. The value can come from the data table, or can be an arbitrary calculation or JSL expression. You can customize these names or values using gridlets. For example, here are some things that you can do:
• Remove a name and its associated value
• Add a name and its associated value
• Change a name
• Change the style of a name (for example, bold) or a value (for example, decimal places)
Tip: Another way to customize hover label grid entries is using labels. See Add Images from Data Tables to Hover Labels.
Example of Updating Names and Values
In this example, you create a graph and update content in the hover label using gridlets.
Create the Original Graph
1. Select Help > Sample Data Library and open Movie Inventory.jmp.
These data show movie rental data.
2. Select Graph > Graph Builder.
3. Select Length and drag it to the Y zone.
4. Select Year and drag it to the X zone.
5. Click Done.
6. Place your pointer over the point in row 34 (Figure 9.56).
Figure 9.56 Initial Hover Label Content for Row 34
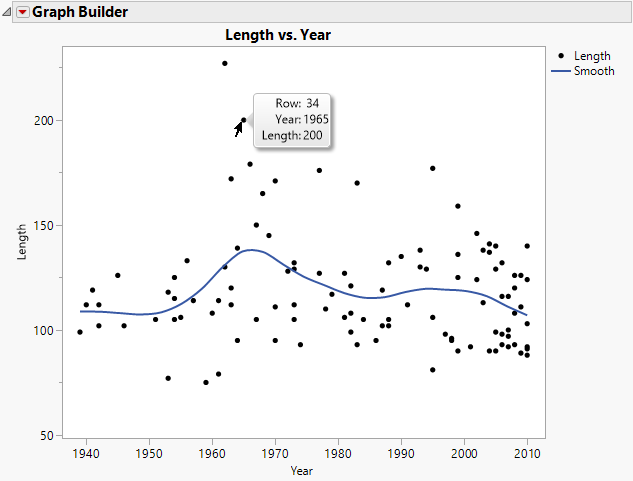
For the data point in row 34, you can see the row number, the year in which the movie was made, and the length of the movie (in minutes). You want to change what appears in the hover labels, as follows:
• Remove the row number and the length entry.
• Add the movie name and genre.
• Create a new entry that shows the length of the movie in hours and minutes.
• Make the genre name bold.
Update Names and Values
1. Place your pointer over the hover label for row 34 and click Pin  .
.
Pinning the hover label enables you to see your changes as you apply them.
2. Right-click in the graph and click Hover Label > Hover Label Editor.
3. At left, click Gridlet.
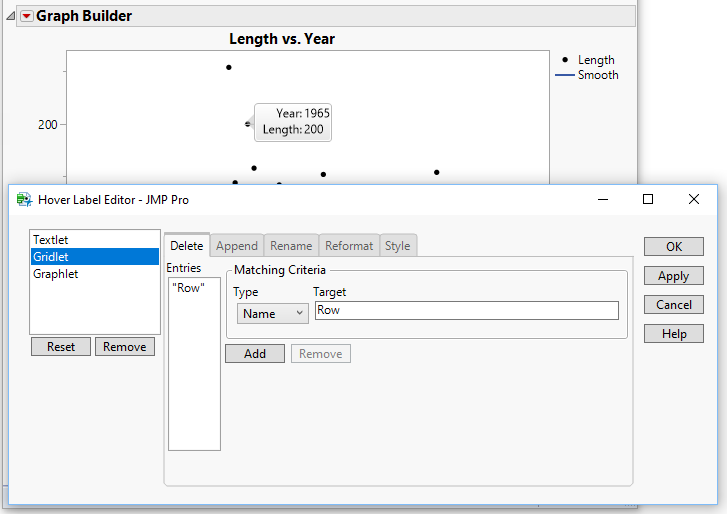
4. Remove the row and length entries:
a. Notice that on the Delete tab, Type is set to Name.
b. Under Target, type Row (the name of the entry you want to remove).
c. Click Add and then click Apply.
In the hover label, you can see that Row is removed.
Figure 9.57 Hover Label with Row Removed
d. Under Target, type Length (the name of the other entry that you want to remove).
e. Click Add and then click Apply.
In the hover label, you can see that Length is removed, leaving only Year.
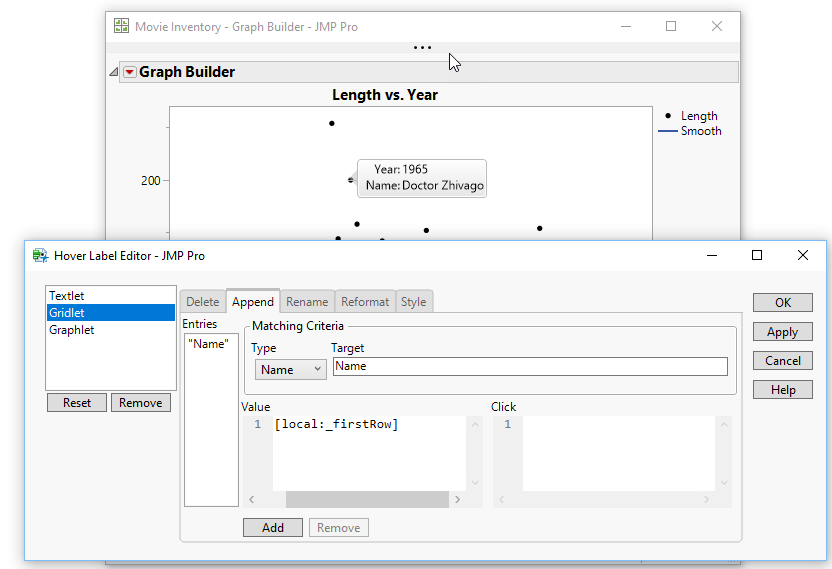
5. Add the movie name and genre:
a. Click the Append tab. Type should be set to Name.
b. Under Target, type Name (the name that you want to add).
c. Under Value, copy and paste the following JSL expression: :Name[local:_firstRow]
Name is the column reference. Brackets indicate to get the corresponding column value for the given index. local:_firstRow is the index, which is a Hover Label Execution Context (HLEC) variable. For details, see Work with the Hover Label Execution Context in the Scripting Guide.
d. Click Add and then click Apply.
In the hover label, you can see that the name of the movie is added.
Figure 9.58 Hover Label with Name Added
e. Under Target, type Genre (the next name you want to add).
f. Under Value, copy and paste the following JSL expression: :Genre[local:_firstRow]
g. Click Add and then click Apply.
In the hover label, you can see that the genre of the movie is added.
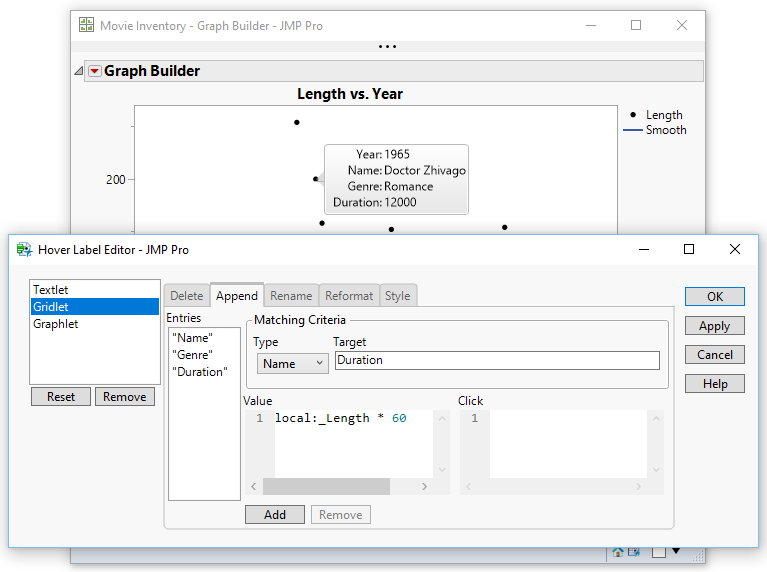
6. Convert the Length data from minutes to hours and minutes:
a. On the Append tab, in the Target box, type Duration (the name of the new hover label that you want to add).
b. Under Value, copy and paste the following JSL expression: local:_Length * 60
local:_Length is an HLEC variable, with the value of the grid entry Length. Length is in the graph, so we have access to this value in the hover label context. For details, see Work with the Hover Label Execution Context in the Scripting Guide.
* 60 converts the duration from minutes to seconds. In order to apply the hours:minutes format, the duration needs to be in seconds.
c. Click Add and then click Apply.
In the hover label, you can see the Duration label is added. But the value needs to be formatted correctly.
Figure 9.59 Hover Label with Duration Added
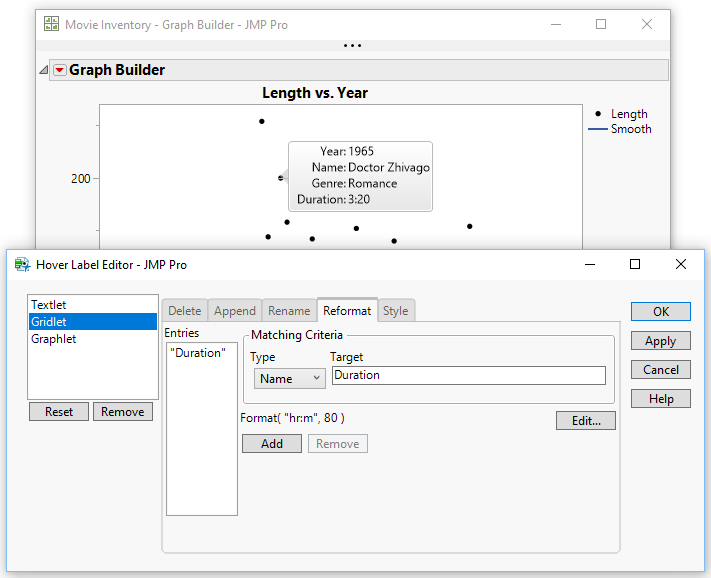
d. Click the Reformat tab.
e. Type is set to Name. In the Target box, type Duration (the name of the hover label entry that you want to reformat).
f. Click Edit.
g. Next to Format, select Duration > hr:m and then click OK.
h. Click Add and then click Apply.
On the hover label, you can see that the Duration is now in hours and minutes.
Figure 9.60 Hover Label with Duration in Hours and Minutes
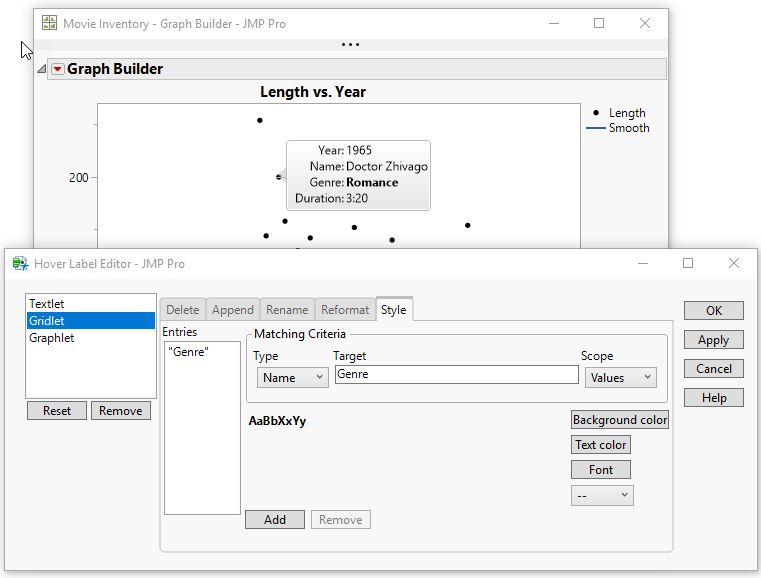
7. Make the Genre values bold:
a. Click the Style tab.
b. Notice that Type is set to Name.
c. Under Target, type Genre (the name of the hover label entry, you want to make bold).
d. In the Scope box, click Values.
This bolds the Genre values instead of the name Genre.
e. Click Font.
f. Under Font style, click Bold and then click OK.
g. Click Add and then click Apply.
On the hover label, you can see that the Genre value, Romance, is now bold.
Figure 9.61 Hover Label with Genre Value in Bold
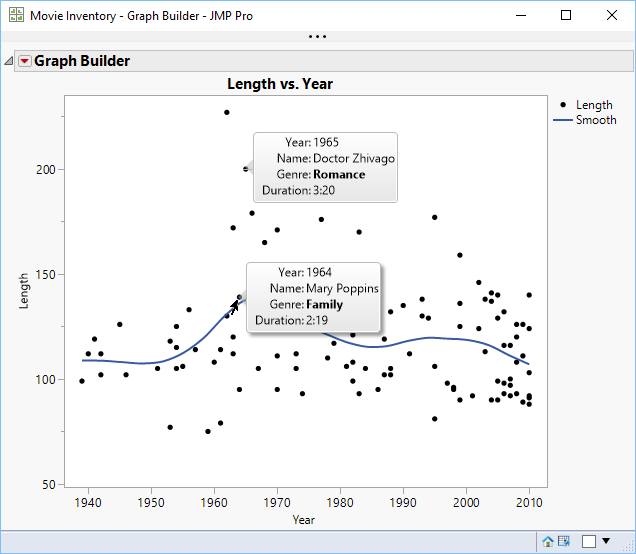
Place your pointer over the other labels to see that they are all updated.
Figure 9.62 Updated Hover Labels
Use Labels in Data Tables
In addition to gridlets, you can also do some basic customization of hover labels by adding Labels to columns in data tables.
• If your hover label contains a Row entry, you can replace it with values in columns by adding a Label.
• Once you add a Label, you can make it persist on the graph. You can also move the label’s location on the graph. A tag line might be added to connect the label to its point.
Example Using Labels
1. Select Help > Sample Data Library and open Iris.jmp.
2. Select Graph > Graph Builder.
3. Select Sepal length and drag it to the Y zone.
4. Select Sepal width and drag it to the X zone.
5. Click Done.
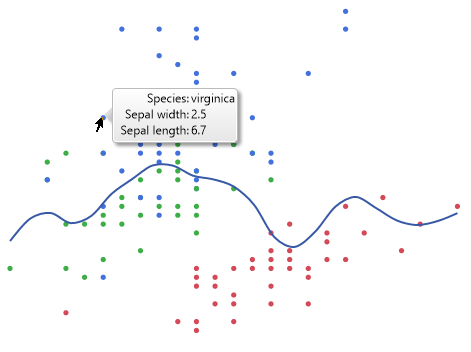
6. Place your pointer over the point in row 109.
Figure 9.63 Hover Label for Row 109
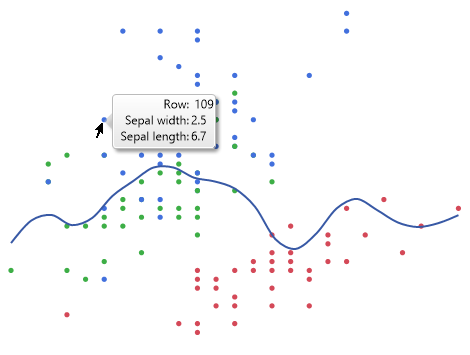
You can see that a Row entry appears in the hover label. You want to replace it with a column and its value from the data table called Species.
7. In the data table, right-click the Species column and select Label/Unlabel.
A label icon  appears beside the column name in the Columns panel.
8. In Graph Builder, hover over the same data point.
Figure 9.64 Hover Label Showing Species Column
You can see that the Row entry is replaced by the Species column.
Note: If you specify multiple labeled columns, their values appear alphabetically in the hover label.
Now, you want to make some of the labels persist on the graph.
9. Click the same data point to highlight it.
10. Right-click anywhere and select Rows > Row Label.
Note: In a histogram, right-click the box plot area on the right.
Figure 9.65 Species Label Showing on Graph
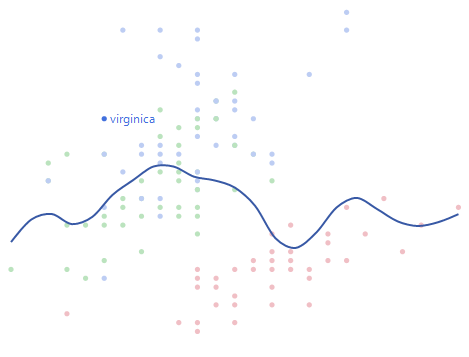
You can see that the label containing the Species value for this data point appears on the graph.
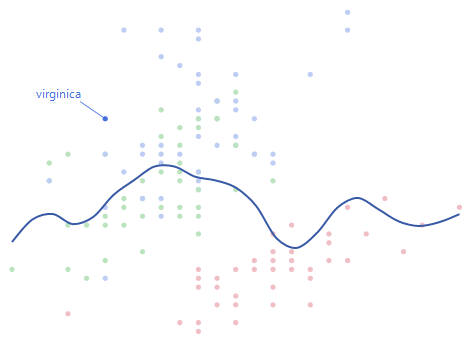
11. Click and drag the label to move its position.
A tag line is added to connect the label to the point.
Figure 9.66 Reposition the Species Label
In the data table, a label icon appears beside the row number.
Data remains labeled until you highlight the column or row and select Label/Unlabel again.