Order the Levels of a Categorical Variable
JMP orders the levels of a categorical variable according to the following rules:
• Numeric, nominal data are sorted numerically.
– White space around numbers is compared: “vt 1” is sorted before “vt1”.
• Character data that are only digits (numbers) are sorted numerically.
• Character data are sorted alphabetically, with the following exceptions:
– Months and days of the week are in chronological order.
– Ratings are sorted from low to high:
Low to high: Very Low, Low, Medium Low, Medium, Medium High, High, Very High
Agreement: Strongly Disagree, Disagree, Neutral, Indifferent, Agree, Strongly Agree
Bad or good: Failing, Unacceptable, Very Poor, Poor, Bad, Acceptable, Average, Good, Better, Very Good, Excellent, Best
– Character data that have a character prefix and a numeric suffix are sorted first by prefix and then by suffix. For example, lots 1 through 12 are ordered “lot1”, “lot2”, “lot3”,...”lot10”, “lot11”, and “lot12”.
– If the numeric suffix starts with a “0”, it does not follow numeric ordering by suffix. (“lot1” is ordered after “lot02”).
Note: The preceding rules apply only to graphs with categorical axes.
To change the order of the levels of a categorical variable on a graph axis, click and hold a level on the axis to enter edit mode. In the edit mode, denoted by boxes around each label, you can drag one or more labels (using shift-click for multiple selection) to rearrange them. As you rearrange labels, the value order column property is updated. You can also edit labels, which updates the value label column property. Press Esc to exit the edit mode.
You can also order the levels of a categorical (nominal or ordinal) variable on axes using the Value Order column property, which takes precedence over all other ordering rules. To change the ordering, you can do one of the following:
• Use the Value Order column property to ensure that values are ordered as you intend. For more information about the Value Order column property, see Value Order in Using JMP.
• Use the values of a numeric variable already in the graph. In Graph Builder, right-click the categorical axis and select Order By.
• Use the values of an arbitrary numeric variable. In Graph Builder, drag the numeric variable next to the categorical variable in the zone until a trapezoid appears and then drop the variable. The axis label changes to <categorical variable> ordered by <numeric variable>. See Example of Ordering the Levels of a Categorical Variable Using a Numeric Variable.
Change the order of the levels or the statistic:
1. Right-click the axis label and select Order By.
2. Select one of the ascending or descending options or other to select a numerical column.
You can order by a variable’s Order Statistic (these options are prefixed by the variable’s name) or by the number of observations in each level of the categorical variable (Count).
3. The default ordering statistic is the mean. To use another statistic, right-click the axis label and select Order Statistic.
Note: If you try to order the values of a numeric variable using another numeric variable, JMP merges the variables. See Merge Variables on a Common Axis.
Example of Ordering the Levels of a Categorical Variable Using a Numeric Variable
To order a nominal or ordinal variable by a numeric variable, consider data about vehicle types. You want to see the vehicle types arranged in a meaningful order.
1. Select Help > Sample Data Library and open Cars.jmp.
2. Select Graph > Graph Builder.
3. Select Size and drag it into the X zone.
This variable represents the type of the vehicle. Eight levels are listed alphabetically on the X axis: compact (comp), heavy (hev), lightweight (lt), medium (med), mini, multi-purpose (mpv), pick-up truck (pu), and van. Since the levels are listed alphabetically, they are not ordered in a meaningful way. For example, heavy comes before mini and lightweight. You want to order the levels by Wt (weight).
4. Select Wt and drag it to the middle of the X axis. Drop it just above the X axis. Before you drop the variable, a blue quadrilateral appears.
Figure 3.19 Merging Wt and Size
The levels of Size are now arranged in increasing order according to the average Wt of all vehicles in the levels. Notice that mini and lt (lightweight) are now ordered before hev (heavy). The axis label is updated, signifying that an ordering variable is in use.
Next, verify that Size is actually ordered by Wt.
5. Select Wt and drag it to the Y zone.
6. Select Mean from the Summary Statistic list.
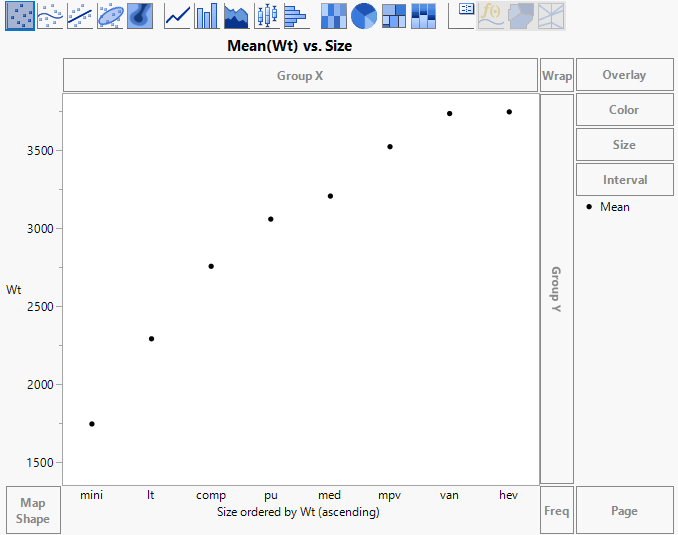
Figure 3.20 Example of Size Ordered by Wt, Ascending
You can see that the average Wt increases from left to right.
Change the order from ascending to descending.
7. Right-click in the X zone and select Order By > Wt, descending.
Now the levels of Size are arranged in decreasing order of mean Wt. You want to see whether the right femur load (R Leg) decreases with vehicle weight.
8. Right-click Wt in the Y zone and select Remove.
9. Select R Leg and drag it to the Y zone.
10. Select None from the Summary Statistic list.
This selection replaces the means with points for all the individual observations.
11. Click the Smoother element ![]() .
.
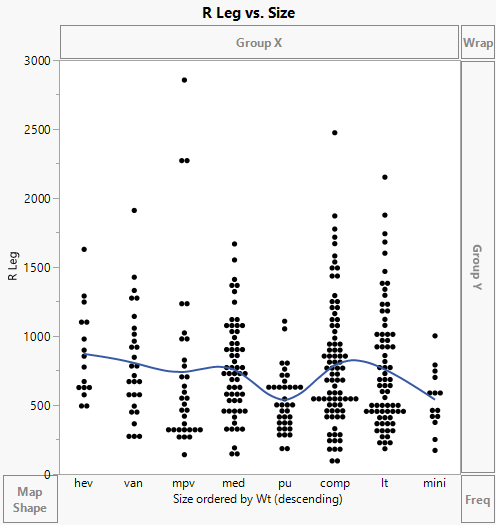
Figure 3.21 Example of R Leg Ordered by Wt, Descending
R Leg seems unrelated to the weight classes.
The default ordering statistic is the mean. To use another statistic, right-click in the X zone, select Order Statistic and change it to the statistic that you want.


