Pop-Up Menu
Right-click the 3D scatterplot to find the following options.
Show Legend
Shows and hides the color legend for the 3D scatterplot.
Note: This option requires the Coloring role.
Reset
Returns the orientation of the scatterplot to its original state.
Settings
Provides options to change the appearance of the 3D scatterplot. See Scatterplot 3D Settings.
Hide Lights Border
Shows and hides a border that displays the lights. The lights highlight different portions of the 3D scatterplot.
Right-click a light to turn it on or off and to change the color.
Wall Color
Changes the color of the 3D scatterplot.
Background Color
Changes the color surrounding the 3D scatterplot.
Rows
You can color, mark, exclude, hide, and label points that correspond to rows in the associated data table. You must select the points before selecting this option. See Select a Rectangular Area of Points in a JMP Graph and Select an Irregularly Shaped Area of Points in a JMP Graph in Using JMP.
Use Hardware Acceleration
Turns hardware acceleration on or off for machines that support acceleration. This option might display the scatterplot faster. If not, try updating your graphics drivers.
Show ArcBall
Shows and hides a globe around the 3D scatterplot. This option helps you visualize the rotation of the scatterplot. Select whether you want the ArcBall to appear always, only when you drag the scatterplot, or never.
Scatterplot 3D Settings
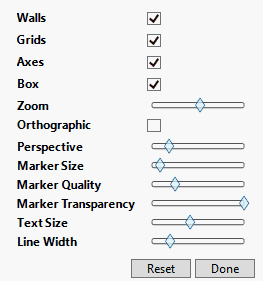
To customize properties such as the marker size, text size, and grid lines, right-click the 3D scatterplot and select Settings. The Settings window appears. As you modify the settings, a preview appears on the 3D scatterplot.
Figure 9.7 The Scatterplot 3D Settings Window
Note the following:
• Move the sliders left to decrease the selected property or to the right to increase the selected property.
• To move the Settings window around the scatterplot, click and drag the top portion of the window.
The following options are available:
Reset
Resets the default settings.
Done
Closes the window.
Walls
Adds or removes the 3D scatterplot walls. Without walls, the background color of the 3D scatterplot is displayed.
Grids
Shows or hides the coordinate lines.
Axes
Shows or hides the variable names that appear above each axis.
Box
Shows or hides the box. Without the box, the 3D scatterplot is displayed as an open plot.
Zoom
Enlarges or shrinks the 3D scatterplot.
Orthographic
Changes the view of the scatterplot from 3-dimensional to an orthographic projection. In the orthographic view, the walls of the scatterplot do not converge to a vanishing point. This means that you can compare near and far distances and see the structure between data points.
Note: If you turn off orthographic view and completely decrease the perspective, the walls of the scatterplot do not converge. This is the same effect that you get when you turn on orthographic view.
Perspective
Increases or decreases the perspective. Large values create a view that is unnaturally large and visually disorienting. In this case, you need to resize the scatterplot window to show the entire plot.
Marker Size
Increases or decreases the size of the data point markers.
Marker Quality
Increases and decreases the data marker quality. For example, when you increase the marker quality, some markers have an opaque center. Other symbol markers are formatted in bold. Increase the zoom to see these changes in quality.
Marker Transparency
Increases or decreases the transparency of the data markers.
Text Size
Increases or decreases the text size.
Line Width
Changes the width of the coordinate and axes lines.
