For the latest version of JMP Help, visit JMP.com/help.


Quality and Process Methods > Legacy Control Charts
Publication date: 06/21/2023

Legacy Control Charts

Create Variable and Attribute Control Charts

The legacy control chart platforms in JMP provide a variety of control charts, as well as runs charts, V-Mask CUSUM charts, and weighted moving average charts. To support process improvement initiatives, most of the control chart options display separate control charts for different phases of a project on the same chart.

A control chart is a graphical and analytic tool for monitoring process variation. The natural variation in a process can be quantified using a set of control limits. Control limits help distinguish common-cause variation from special-cause variation. Typically, action is taken to identify and eliminate special-cause variation. It is also important to quantify the common-cause variation in a process, as this determines the capability of a process.

Figure 14.1 Control Chart Example 
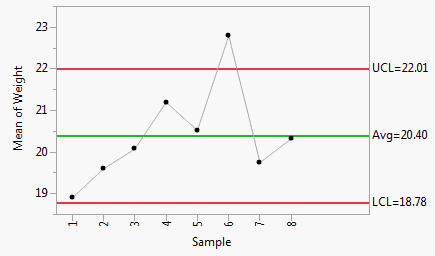
Control Chart Example

Contents

Overview of Legacy Control Charts

Legacy Control Charts for Variables
Legacy Control Charts for Attributes

Example of a Legacy Control Chart

Launch a Legacy Control Chart Platform

Process Information
Limits Specifications
Specified Statistics

Legacy Control Chart Reports

V-Mask CUSUM Chart Reports

Interpret a Two-Sided V-Mask CUSUM Chart
Interpret a Legacy One-Sided CUSUM Chart

Legacy Control Chart Platform Options

Window Options for Legacy Control Charts
Chart Options for Legacy Control Charts
Chart Options for V-Mask CUSUM Control Charts

Saving and Retrieving Limits

Excluded, Hidden, and Deleted Samples

Additional Examples of Legacy Control Charts

Example of Presummarized Charts
Example of a V-Mask CUSUM Chart
Example of a One-Sided CUSUM Chart
Example of a UWMA Chart

Statistical Details for Legacy Control Charts

Statistical Details for Median Moving Range Charts
Statistical Details for Capability Analysis
Statistical Details for V-Mask CUSUM Control Charts
Statistical Details for Weighted Moving Average Charts
Want more information? Have questions? Get answers in the JMP User Community (community.jmp.com).