Data Table Panels
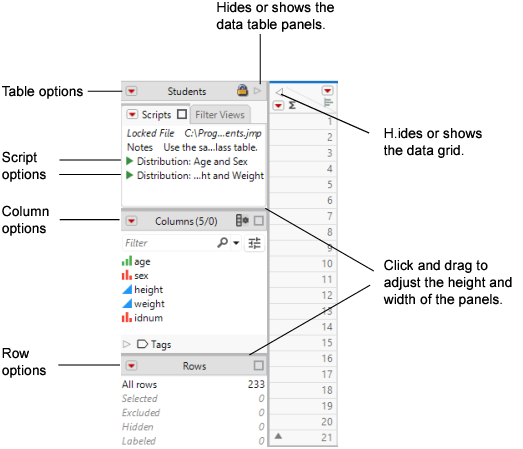
In JMP data tables, the Table, Columns, and Rows panels contain information about the data table and its contents. These interactive panels are located on the left side of the data grid.
Figure 2.4 Interacting with the Data Table Panels
Table Panel in Data Tables
The Table panel contains the following elements:
• data table name
• the Scripts panel
• the Filter Views panel
• icons that indicate the table state
• red triangle menus that contain table options
Figure 2.5 Example of a Table Panel
Table Options
Clicking on the red triangle menu next to the data table name shows these options:
Tables
Contains the same options as the Tables menu. See “Reshape Your Data”.
Suppress Formula Eval
Turns off the feature that automatically evaluates formulas. You can turn off evaluation and build sections of a formula. To then test the formula, deselect Suppress Formula Eval.
Lock Data Table
Locks the data table so that data and column properties cannot be edited or added. You can still run analyses and assign characteristics. See “Lock Data Tables”.
Compress file when saved
Compresses the data table when it is saved. After the data table is saved, a compressed file icon (![]() ) appears next to the data table name in the table panel. See “Compress Data Tables”.
) appears next to the data table name in the table panel. See “Compress Data Tables”.
The Compress file when saved option only decreases the file size. This option does not affect the memory that is required to analyze the data. To reduce both the file size and memory that is required for analyzing, select Cols > Utilities > Compress Selected Columns. See “Compress Selected Columns in Data Tables”.
Tip: You can also configure JMP to always use GZ compression when saving tables by selecting Preferences > General > Save Data Table Columns GZ Compressed.
Disable Undo
Removes all actions from the undo history and does not record future actions. Undo actions are disabled only while the data table is open. The setting is not saved with the data table. This option saves memory, especially when you delete many rows or perform other tasks on the data table that require a large amount of memory to record the data.
Copy Table Script
Copies the script that re-creates the table. To re-create the table, put the copied script in a new script and run it. Note that referenced columns in virtually joined tables are not included in the script.
Copy Table Script (No Data)
Copies the script that re-creates the table but omits the data.
Rerun Formulas
Re-evaluates all columns that contain formulas within the data table.
Scripts Panel in Data Tables
The Scripts panel is a sub-panel of the Table panel. It contains the following optional elements:
• Table variables
• Green triangles for table scripts
Script Options
To run a script from the scripts panel, click the green triangle (![]() ) next to the script name. Right-clicking the script name or green triangle shows these options:
) next to the script name. Right-clicking the script name or green triangle shows these options:
Run Script
Runs the script.
Tip: Run multiple table scripts at once by pressing Ctrl while selecting the table scripts that you want to run. Then, right-click inside the empty area under the list of table scripts, and select Run Script.
Edit
Opens most scripts in the script editor so that you can edit it. Opens a JMP application script in Application Builder.
Edit with Recode
Opens a recode script (which you created by recoding a column and saving the script) in the script editor.
Delete
Deletes the script.
Group Scripts
Moves the selected scripts into a group. Click the group name to rename it. This option is helpful when you want to organize scripts or minimize a long list of scripts.
Ungroup Scripts
Ungroups scripts in the selected group to return them to the top level.
Copy
Copies the script. You can then paste the script into the Table panel of another data table.
Paste
Pastes the script from another data table.
Debug Script
Opens the script in the JSL Debugger. See “Debug or Profile Scripts” in the Scripting Guide.
Clicking on the red triangle menu next to the data table name shows these options:
New Table Variable
Creates a new table variable, which can be text or any other constant character value that you always want to be available in the data table. Table variables are normally used to document tables. See “Use Data Table Variables”.
Note: To rename a table variable, double-click it and enter a new name in the Name field.
New Script
Creates a JSL script to save with the data table. After selecting this option, name the script and enter the value (the JSL commands). After you click OK, the new script is listed in the Table panel and you can click its green triangle to run, edit, or delete it. See “Create and Save Scripts in Data Tables”.
Group Scripts
Moves the selected scripts into a group. Click the group name to rename it. This option is helpful when you want to organize scripts or minimize a long list of scripts.
Ungroup Scripts
Ungroups scripts in the selected group to return them to the top level.
Additional Options
In the Table panel, you can also perform the following tasks:
• Double-click a table variable or script name to edit the name and content.
• Drag a table variable or script to rearrange it.
The Filter Views panel
The Filter Views panel is a sub-panel of the Table panel. It contains the following elements:
• The Create a New Filter View button (![]() ).
).
• The Delete Selected Filter Views button ( ).
).
• The Copy Selected Filter Views button (![]() ).
).
• A list of the filter views available for filtering data in the data table. The currently selected filter will be marked with the ![]() symbol.
symbol.
• When a filter view is applied to the data table, the ![]() Exit View item appears below the list of available filter views. This can be used to return the data table to its default unfiltered state.
Exit View item appears below the list of available filter views. This can be used to return the data table to its default unfiltered state.
Columns Panel in Data Tables
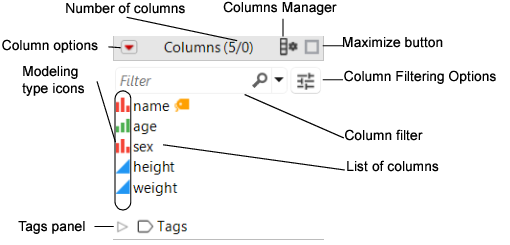
The Columns panel provides a way to view and move columns. The panel contains the following information:
• Column options. This option contains some of the same options as the Cols menu.
• Total number of columns and number of columns selected in the data table.
• The Columns Manager button (![]() ). See “About the Columns Manager”.
). See “About the Columns Manager”.
• A maximize button (![]() ) for the Columns panel.
) for the Columns panel.
• A filter box to help you quickly find columns. Click the magnifying glass icon to set search filter options and parameters.
• The More Column Filtering Options button (![]() ). See “Column Filtering Options”.
). See “Column Filtering Options”.
• A list of columns found in the data table.
• Icons that indicate each column’s modeling type. See “About Modeling Types”.
• Icons that represent characteristics and properties that are assigned to the columns (not shown, see Figure 2.7).
• The Tags panel.
Figure 2.6 Example of a Columns Panel
Icons That Represent Column Characteristics and Properties
Icons to the right side of each column name indicate characteristics and properties that the columns contain.
Figure 2.7 Icons That Indicate Column Characteristics and Properties
Note: Italics indicate that the column is locked into place. When you scroll horizontally, the column remains visible.
Here are the icons that can appear in the Columns panel:
![]() Indicates that points on plots that correspond to the column are labeled by the value instead of by the row number. See “Label Rows and Columns”.
Indicates that points on plots that correspond to the column are labeled by the value instead of by the row number. See “Label Rows and Columns”.
![]() Indicates that the column is excluded from the calculations. See “Exclude Rows in Data Tables”.
Indicates that the column is excluded from the calculations. See “Exclude Rows in Data Tables”.
![]() Indicates that the column is not included in graphs. See “Hide Rows in Data Tables”.
Indicates that the column is not included in graphs. See “Hide Rows in Data Tables”.
![]() Can be X or Y. Indicates that the column has been assigned the preselected role of x or y. See “Assign a Preselected Analysis Role to a Column”.
Can be X or Y. Indicates that the column has been assigned the preselected role of x or y. See “Assign a Preselected Analysis Role to a Column”.
 Indicates that the column has been assigned the preselected role of validation. See “Assign a Preselected Analysis Role to a Column”.
![]() Indicates that the column contains one or more properties. Click to reveal a list of properties that the column contains.
Indicates that the column contains one or more properties. Click to reveal a list of properties that the column contains.
![]() Indicates that the values in the column are the result of a formula. When formula evaluation is suppressed, the icon appears gray. Double-click to view and edit the formula. See “JMP Formula Editor Options”.
Indicates that the values in the column are the result of a formula. When formula evaluation is suppressed, the icon appears gray. Double-click to view and edit the formula. See “JMP Formula Editor Options”.
![]() Indicates that the range check or the list check option is turned on. Click to view and edit the range or list. See “Range Check” and “List Check”.
Indicates that the range check or the list check option is turned on. Click to view and edit the range or list. See “Range Check” and “List Check”.
![]() Indicates that the column has been assigned the preselected role of weight. See “Assign a Preselected Analysis Role to a Column”.
Indicates that the column has been assigned the preselected role of weight. See “Assign a Preselected Analysis Role to a Column”.
![]() Indicates that the column has been assigned the preselected role of frequency. See “Assign a Preselected Analysis Role to a Column”.
Indicates that the column has been assigned the preselected role of frequency. See “Assign a Preselected Analysis Role to a Column”.
![]() Indicates that the column values cannot be edited. See “About the Column Info Window”.
Indicates that the column values cannot be edited. See “About the Column Info Window”.
![]() Indicates that the expression column contains images that can be used as markers. See “Use Images as Markers”.
Indicates that the expression column contains images that can be used as markers. See “Use Images as Markers”.
Virtual Join Icons
 Indicates that the column has a Link Reference column property. This property links a column in the current data table to the ID column in the referenced data table. Blue indicates that the referenced data table is linked.
 Indicates that the column has a Link Reference column property. Gray indicates that the referenced data table is not open or not linked properly.
 Indicates that the column has a Link ID column property, which marks a column in the data table as the ID column. That is, the rows of the data table are uniquely identified by the values of the ID column.
 Indicates that the column is linked from the referenced data table.
For more information about virtual join, see “Virtually Join Data Tables”.
Search Filter Options
To show search filter options in the columns list, select the drop down button (![]() ) next to the Filter search field in the Columns panel. This enables you to customize your search for columns, which is particularly helpful with long lists of columns.
) next to the Filter search field in the Columns panel. This enables you to customize your search for columns, which is particularly helpful with long lists of columns.
Click the down arrow button next to the search box to refine your search.
Contains Terms
Returns items that contain a part of the search criteria. A search for “ease oom” returns messages such as “Release Zoom”.
Contains Phrase
Returns items that contain the exact search criteria. A search for “text box” returns entries that contain “text” followed directly by “box” (for example, “Context Box” and “Text Box”).
Starts With Phrase
Returns items that start with the search criteria.
Ends With Phrase
Returns items that end with the search criteria.
Whole Phrase
Returns items that consist of the entire string. A search for “text box” returns entries that contain only “text box”.
Regular Expression
Enables you to use the wildcard (*) and period (.) in the search box. Searching for “get.*name” looks for items that contain “get” followed by one or more words. It returns “Get Color Theme Names”, “Get Name Info”, and “Get Effect Names”, and so on.
Invert Result
Returns items that do not match the search criteria.
Match All Terms
Returns items that contain both strings. A search for “t test” returns elements that contain either or both of the search strings: “Pat Test”, “Shortest Edit Script” and “Paired t test”.
Ignore Case
Ignores the case in the search criteria.
Match Whole Words
Returns items that contain each word in the string based on the Match All Terms setting. If you search for “data filter”, and Match All Terms is selected, entries that contain both “data” and “filter” are returned.
Rows Panel in Data Tables
The Rows panel contains the following information:
• row options (same options as the Rows menu)
• total number of rows
• number of selected (highlighted), excluded, hidden, and labeled rows
Figure 2.8 Example of a Rows Panel
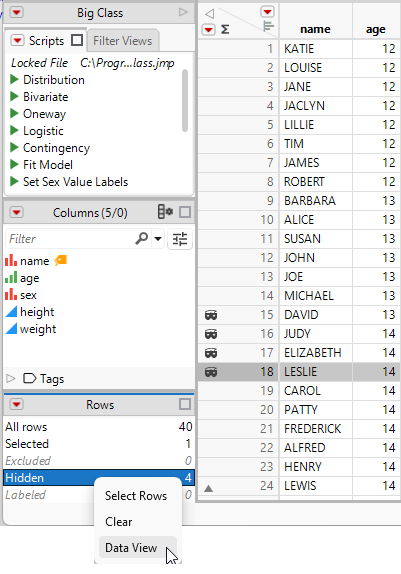
Right-click the categories in the Rows panel to select rows, clear the selection, or to create a data view.
A data view creates a linked subset of the main data table. For example, if several rows are marked as hidden, you might want to open a window that shows you only the hidden rows. Right-click Hidden in the Rows panel and select Data View.
Figure 2.9 Creating a Data View from the Rows Panel
When using a data view, continue to do most of your editing in the main data table. When you make changes in either the main data table or in the data view, the changes are reflected in both. You can make minor changes (such as changing some data or adding a column) in the data view. However, if you want to make major changes (such as adding a formula), you must make those changes in the main data table.


