Exposure Summary
This report generates an exposure plot for all subjects in a study for an investigational product by dose and exposure time for the safety population treatment. Summaries of exposure duration for subjects are also produced along with a static report of counts of total duration periods for subjects. The duration report and summary can be produced for specific duration times only through use of a duration times list on the Exposure Duration tab. The exposure plot is generated for all subjects across any time of exposure.
Report Results Description
Running Exposure Summary for Nicardipine using default settings generates the Report shown below.
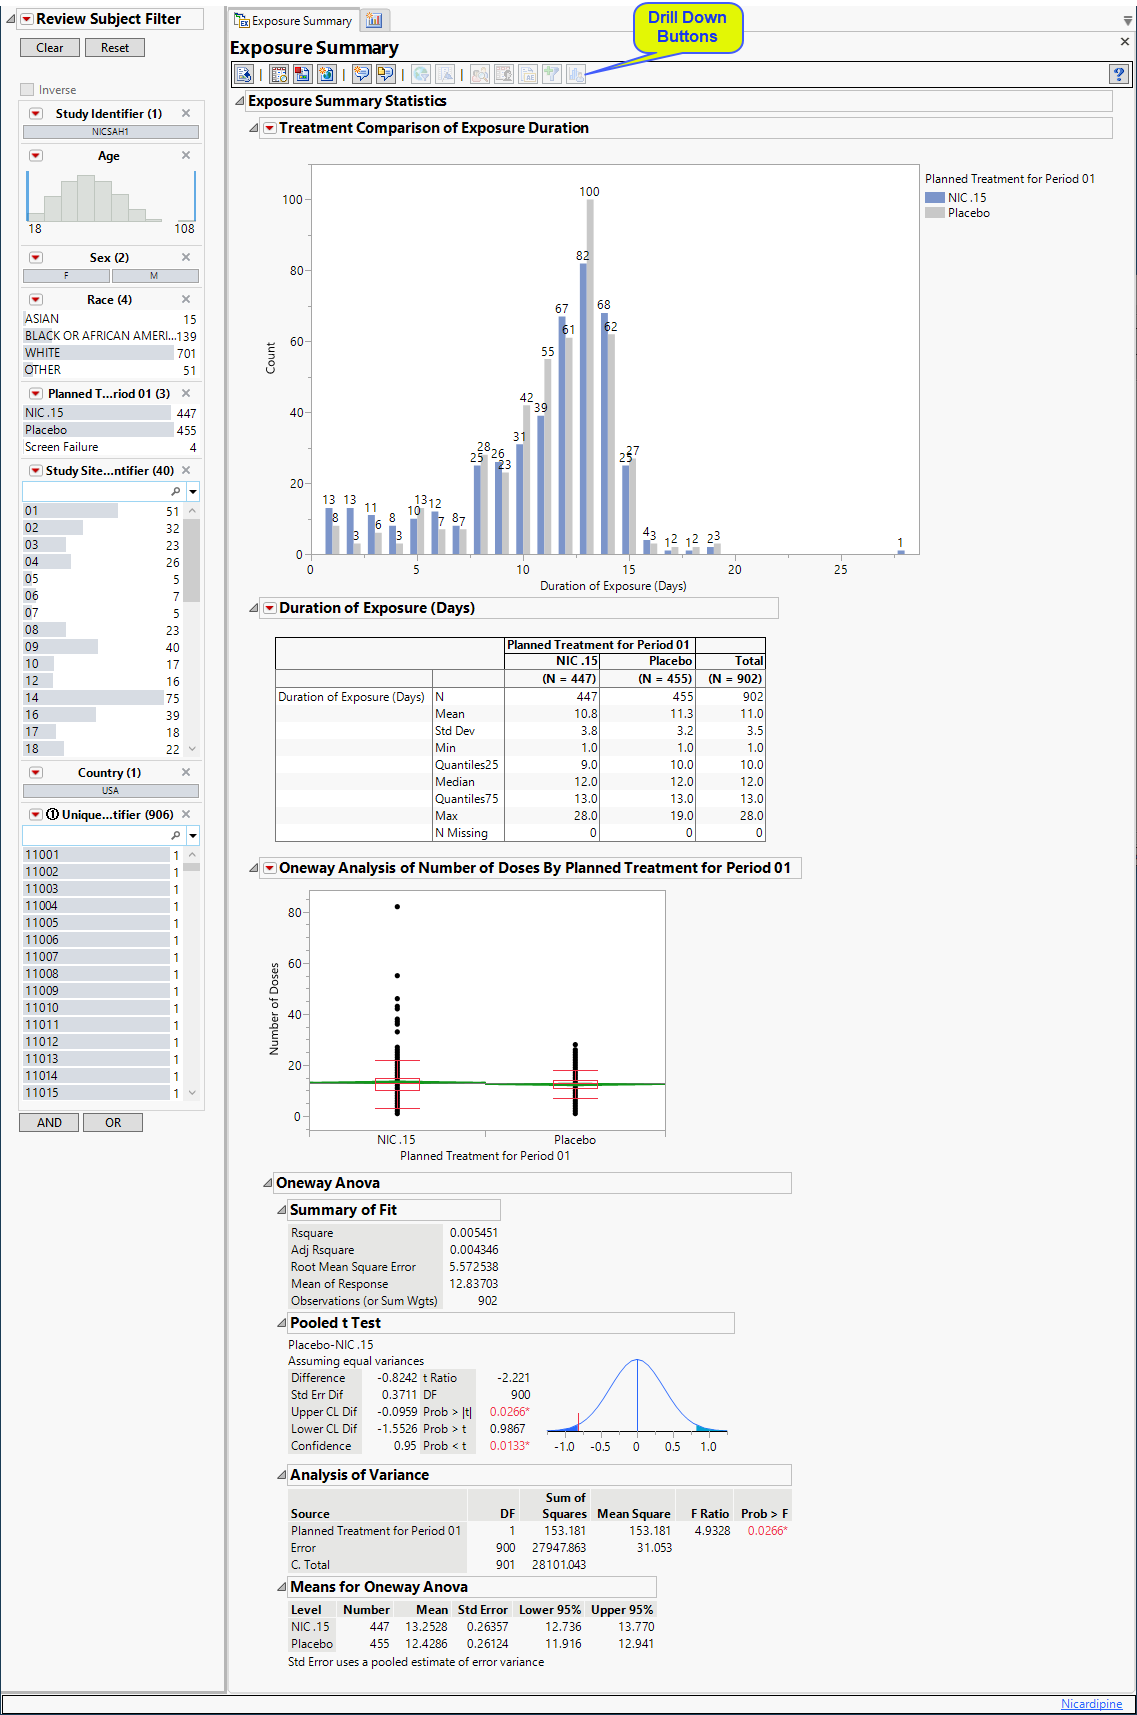
The Report contains the following elements:
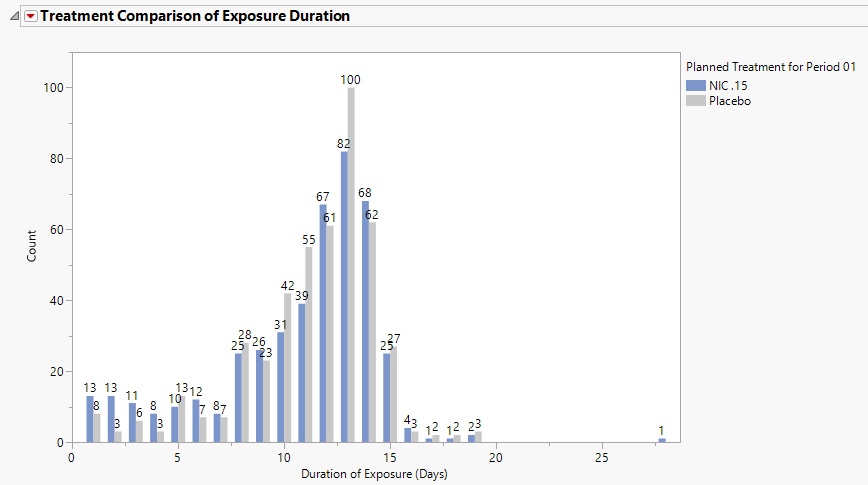
Treatment Comparison of Exposure Duration
Displays a histogram showing the number of subjects exposed to either nicardipine or the placebo and the duration of their exposures.
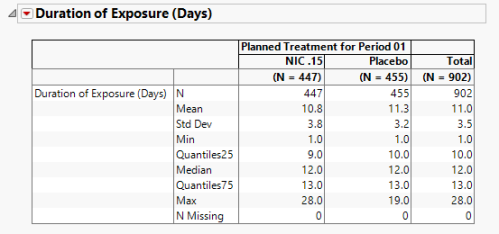
Duration of Exposure Days
Displays a table summarizing the statistics for exposure duration for each treatment arm..
Oneway Analysis
This report performs aone-way ANOVA (analysis of variance) to detect statistical differences for the number of doses subjects in each treatment arm received.
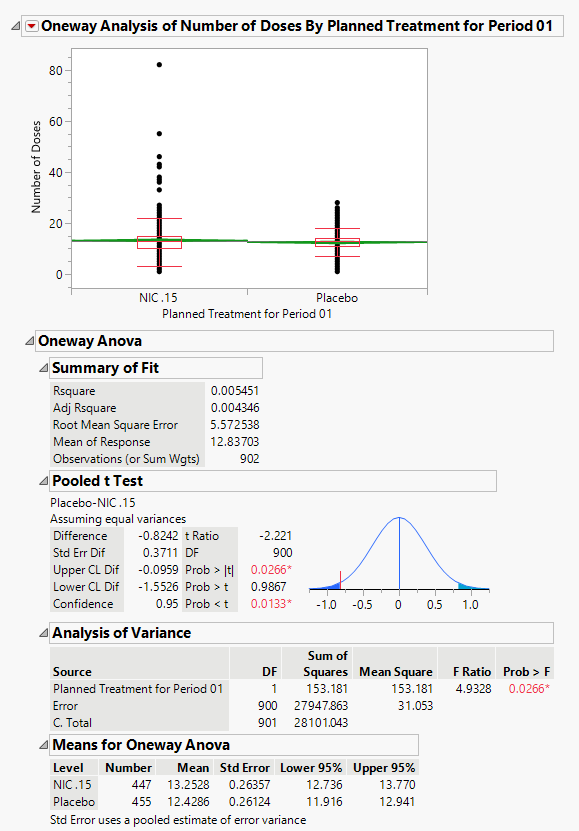
The One-way Plot above shows the distribution of subjects by the number of doses for each of the two treatment arms. The analysis statistics are listed in the tables below the plot.
General and Drill Down Buttons
Action buttons, provide you with an easy way to drill down into your data. The following action buttons are generated by this report:
| • | Click  to rerun the report using default settings. to rerun the report using default settings. |
| • | Click  to view the associated data tables. Refer to Show Tables/View Data for more information. to view the associated data tables. Refer to Show Tables/View Data for more information. |
| • | Click  to generate a standardized pdf- or rtf-formatted report containing the plots and charts of selected sections. to generate a standardized pdf- or rtf-formatted report containing the plots and charts of selected sections. |
| • | Click  to generate a JMP Live report. Refer to Create Live Report for more information. to generate a JMP Live report. Refer to Create Live Report for more information. |
| • | Click  to take notes, and store them in a central location. Refer to Add Notes for more information. to take notes, and store them in a central location. Refer to Add Notes for more information. |
| • | Click  to read user-generated notes. Refer to View Notes for more information. to read user-generated notes. Refer to View Notes for more information. |
| • | Click  to open and view the Subject Explorer/Review Subject Filter. to open and view the Subject Explorer/Review Subject Filter. |
| • | Click  to specify Derived Population Flags that enable you to divided the subject population into two distinct groups based on whether they meet very specific criteria. to specify Derived Population Flags that enable you to divided the subject population into two distinct groups based on whether they meet very specific criteria. |
| • | Profile Subjects: Select subjects and click  to generate the patient profiles. See Patient Profiles for additional information. to generate the patient profiles. See Patient Profiles for additional information. |
| • | Show Subjects: Select subjects and click  to open the ADSL (or DM if ADSL is unavailable) of selected subjects. to open the ADSL (or DM if ADSL is unavailable) of selected subjects. |
| • | Create Subject Filter: Select subjects and click  to open the Create Subject Filter window. See Create Subject Filter for more information. to open the Create Subject Filter window. See Create Subject Filter for more information. |
| • | Demographic Counts: Select subjects and click  to create a data set of USUBJIDs, which subsets all subsequently run reports to those selected subjects. The currently available filter data set can be applied by selecting Apply Subject Filter in any report dialog. to create a data set of USUBJIDs, which subsets all subsequently run reports to those selected subjects. The currently available filter data set can be applied by selecting Apply Subject Filter in any report dialog. |
Default Settings
Refer to Set Study Preferences for default Subject Level settings.
Methodology
**Need information here.