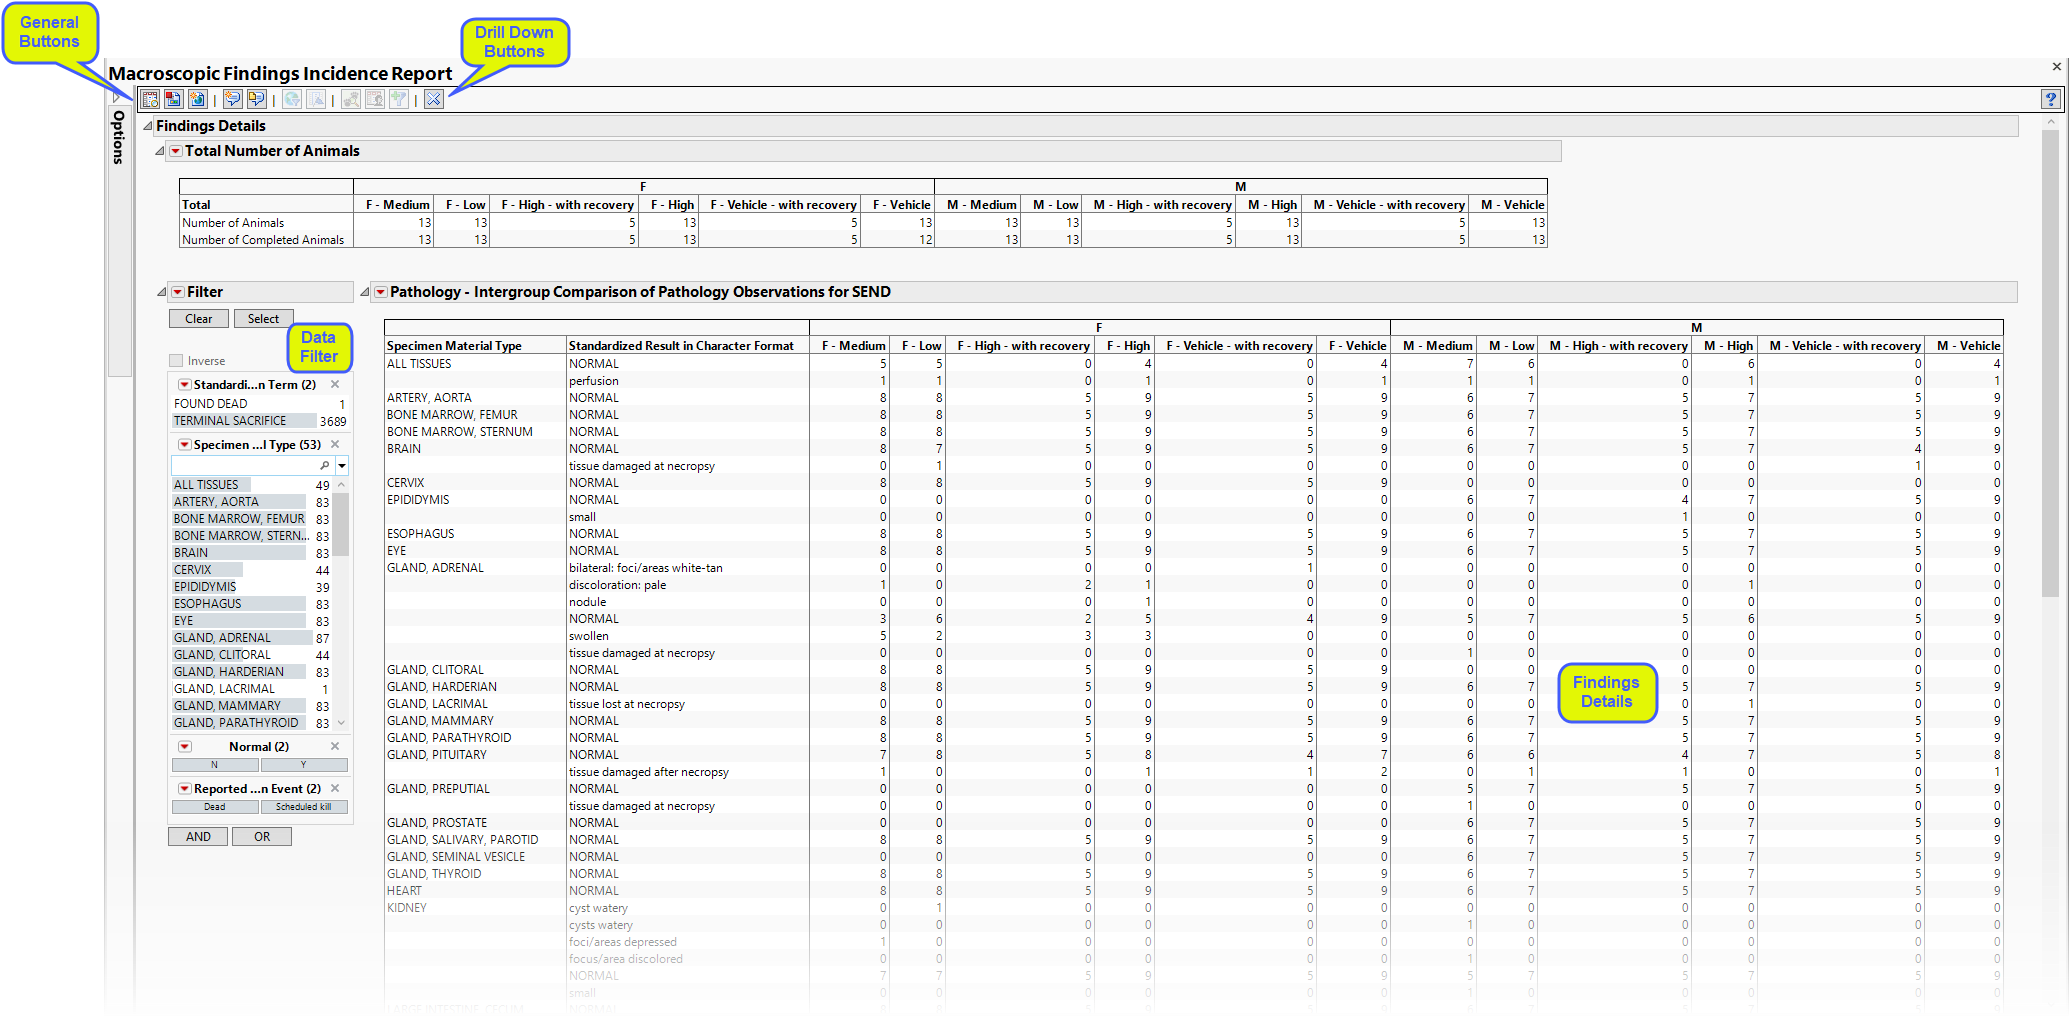
This report creates a summary table of an intergroup comparison of pathology observations. The table is generated from either the Macroscopic (MA) (shown below) or Microscopic (MI) findings domains.
Report Results Description
Running this process generates the report shown below:
The Report contains the following elements:
•
Findings Details: Lists two tables providing details about the total counts of animals, number completing the study across the treatment groups and a high-level summary of the findings.
•
Data Filter: This enables you to subset subjects based on demographic characteristics, disposition, tissue, and other factors. Refer to Data Filter for more information.
Drill Down Buttons
Drill down buttons, provide you with an easy way to drill down into your data. The following drill down buttons are generated by this process:
•
Profile Animals: Generates a static report showing the profile(s) for the selected animals. You must first select one or more animals from either the Intergroup Comparison of Pathology Operations table or the Specimen Type Pathology Comparison table and then click to generate the profile..
Note: You must click to view the associated data tables, including the Specimen Type Pathology Comparison table.
•
Show Animals: Select groups of animals from the Intergroup Comparison of Pathology Operations table or rows from the Specimen Type Pathology Comparison table and click to generate a subset table containing data for the selected animals.
•
Create Animal Filter: Click to create a filter that can be applied in subsequent analyses to reduce the analyzed animals to only the ones currently selected.
General
•
Click to view the associated data tables. Refer to View Data for more information.
•
Click to generate a standardized pdf- or rtf-formatted report containing the plots and charts of selected sections.
•
Click to generate a JMP Live report. Refer to Create Live Report for more information.
•
Click to take notes, and store them in a central location. Refer to Add Notes for more information.
•
Click to read user-generated notes. Refer to View Notes for more information.
Click to specify Derived Population Flags that enable you to divided the subject population into two distinct groups based on whether they meet very specific criteria.
•
Click the arrow to reopen the completed report dialog used to generate this output.
•
Click the gray border to the left of the Options tab to open a dynamic report navigator that lists all of the reports in the review. Refer to Report Navigator for more information.
Report Options
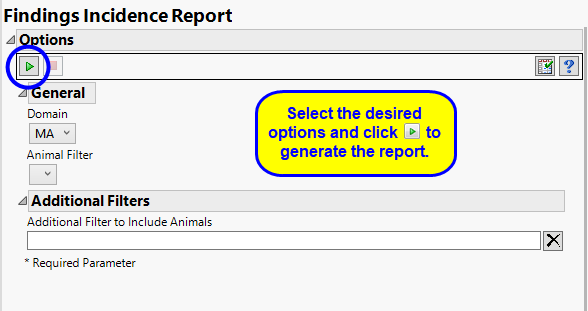
General
Use the Domain to specify whether the data is coming from the MA or MI domain.
Filtering the Data:
Filters enable you to restrict the analysis to a specific subset of animals, based on values within variables.
 to generate the profile..
 to view the associated data tables, including the Specimen Type Pathology Comparison table.
 to generate a subset table containing data for the selected animals.
 to create a filter that can be applied in subsequent analyses to reduce the analyzed animals to only the ones currently selected.
 to view the associated data tables. Refer to View Data for more information.
  to generate a standardized pdf- or rtf-formatted report containing the plots and charts of selected sections.
 to generate a JMP Live report. Refer to Create Live Report for more information.
 to take notes, and store them in a central location. Refer to Add Notes for more information.
 to read user-generated notes. Refer to View Notes for more information.
 to open and view the Subject Explorer/Review Subject Filter.
  to specify Derived Population Flags that enable you to divided the subject population into two distinct groups based on whether they meet very specific criteria.