
DATA INSIGHT
-
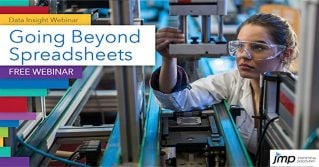 Going Beyond SpreadsheetsIn this video you will see how interactive, no-code analytics enable any scientist or engineer to go beyond spreadsheets and discover patterns in data quickly and easily.
-
 Generating Insights from DataIn this webinar you will learn the importance of using your domain knowledge, experience and intuition alongside statistical and machine learning methods.
-
 Improving Existing ProcessesIn this webinar you will attain a deeper understanding of products and processes when some of the variables are measured at higher frequencies than others.
-
 How to Be a Data DatectiveIn this webinar you will see how interactive, no-code analytics enable any scientist or engineer to be a Data Detective, and to be more effective and efficient at every stage of the process.
-
 Getting Started with Design of Experiments: When Many Factors MatterIn this webinar you will learn how this innovative statistical method can help scientists and engineers in process industries optimize processes and save time and money.