Publication date: 04/28/2021
JMP Reports
Navigate and Customize Report Windows
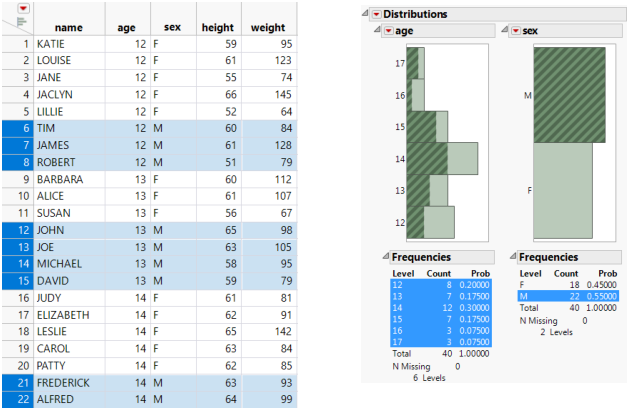
Most JMP platforms present the results of your analyses in a report window. The report window consists of graphs and statistical reports that are often linked to the data table. When you select data in the graph or report, the data is highlighted in the data table. Figure 9.1 shows an example of selected data in a report window and in a data table.
This chapter describes how to customize the colors, lines, data points, and other graphical elements in a report window.
Figure 9.1 Example of a JMP Report Window and Data Table
Contents
Navigate Reports
Use the Hand Tool
Access Report Display Options
Show and Hide Parts of a Report
Combine Several Reports
Rename a Title
Increase Font Sizes
Resize a Window
Red Triangle Options in a Report
Local Data Filter
Redo Menus
Save Script Menus
The Data Filter
Types of Filter Columns
Filtering Modes
The Data Filter Control Panel
Red Triangle Options for the Data Filter
Animation in Data Filters
Red Triangle Options for Variables
Reformat Report Tables
Modify Display Box Properties in a Report
Turn a Report Table Into a Matrix
Use Conditional Formatting
Select Points in Graphs
Select Rows in Graphs
Select a Rectangular Area of Points
Select an Irregularly Shaped Area of Points
Use Markers
Change Marker Shape
Change Marker Colors
Change Marker Size
Work with Crowded Markers
Add Outlines Around Markers
Marker Selection Modes
Specify Marker Transparency
Exclude and Hide Markers
Use Images as Markers
Change Marker Shape or Colors Based On Values
Change the Appearance of Graphs
Resize Graphs
Zoom In and Out
Change Line Widths
Change the Background Color in a Graph
Change the Color of Histogram Bars
Display Coordinates and Temporary Reference Lines
Scroll and Scale Axes
Customize Axes and Axis Labels in the Axis Settings Window
Customize Axes and Axis Labels Using the Pop-Up Menu
Change the Order of Values
Change the Pattern and Format of Selected Objects
Add a Graph to a Data Table
Customize Markers, Lines, Text, and More
Add Images to a Graph or Report
Paste a Background Image into a Graph
Paste an Image at the End of a Report
Drag and Drop an Image into a Graph
Add Geographical Images and Boundaries
Extract Data from an Image
Add Annotations and Shapes to a Report
Add Annotations
Add Shapes
Customize Hover Labels
Add Graphs or Images to Hover Labels
Add Rich Text to Hover Labels
Update Hover Label Grid Entries
Edit Hover Labels
Add Images from Data Tables to Hover Labels
Pin Hover Labels on a Graph
Want more information? Have questions? Get answers in the JMP User Community (community.jmp.com).