Mortality Time to Event
Mortality Time-to-Event groups clinical mortality results by treatment arm and generates Kaplan-Meier survival curves with associated statistics.
Report Results Description
Running this report for Nicardipine using default settings generates the report shown below.
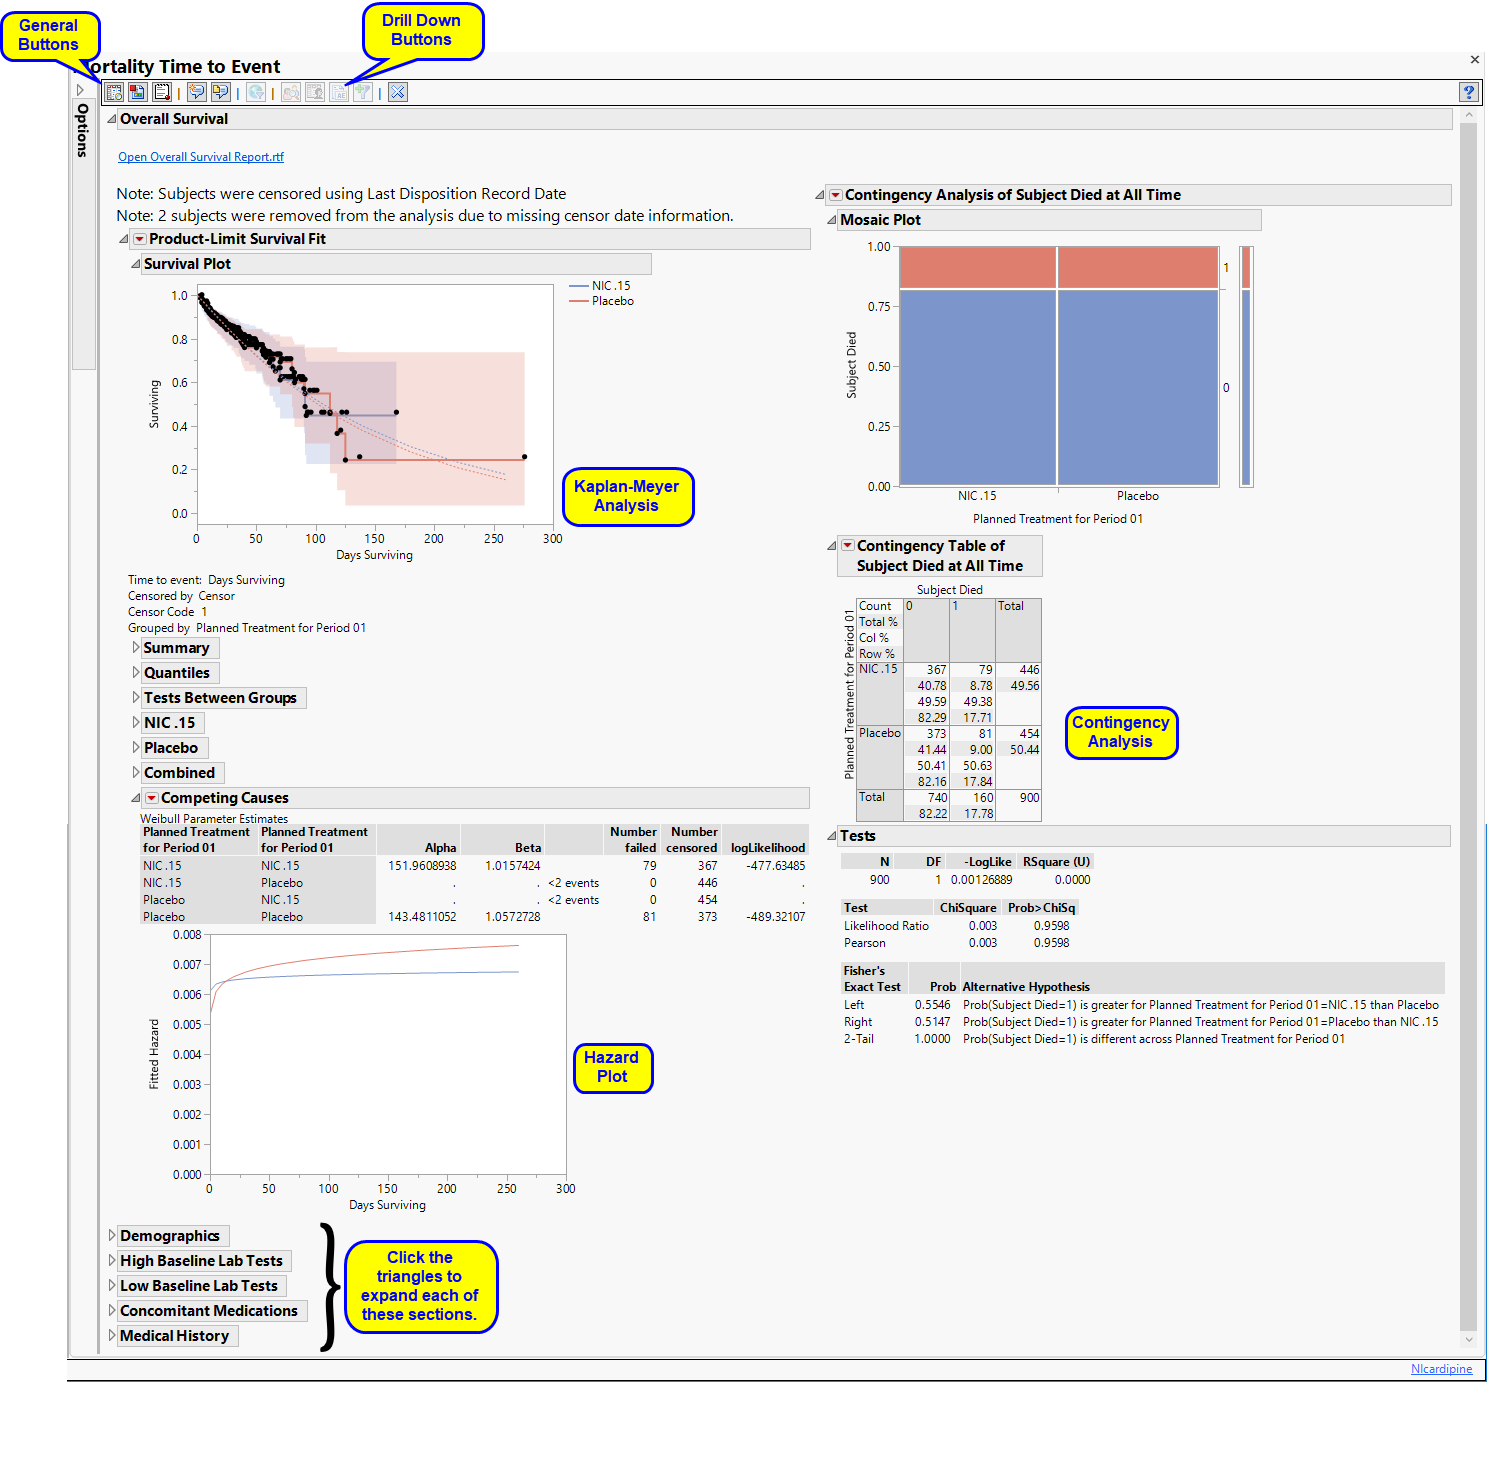
Overall Survival
Contains a Kaplan-Meier time-to-event analysis as well as a Contingency Table of treatment versus death, a Hazard curve, and a data filter.
| • | One Data Filter. |
This enables you to subset subjects based on demographic characteristics and other variables. Refer to Data Filter for more information.
| • | One Survival Plot. |
This analysis compares the time until death of individuals in the study. Otherwise, subjects are censored at the reference end date (RFENDTC).
See Survival Plot for more information.
| • | One Hazard Ratio Event Plot1 |
The Competing Causes section of the includes a Weibull fit and corresponding hazard plot showing treatment emergent adverse event risk over time.
| • | One Contingency Table and Mosaic Plot. |
Compares treatment versus death. This analysis ignores the time at which deaths occur.
See Contingency Table for more information.
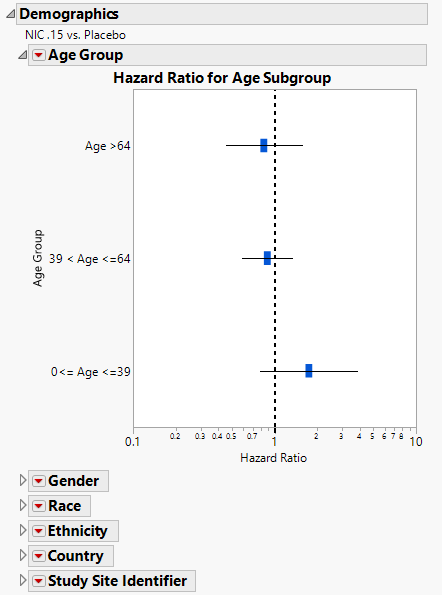
Demographics
Displays Hazard Ratio Event Plot with 95% confidence intervals for each of the following demographic subgroups: age, race, gender, ethnicity, country, and study site identifier.
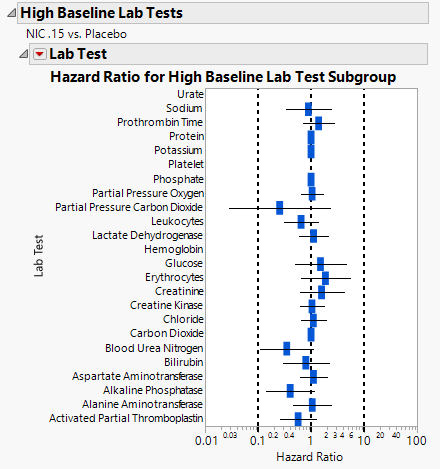
High Baseline Lab Test
Displays a Hazard Ratio Event Plot with 95% confidence intervals for subjects showing abnormally high lab test results at baseline.
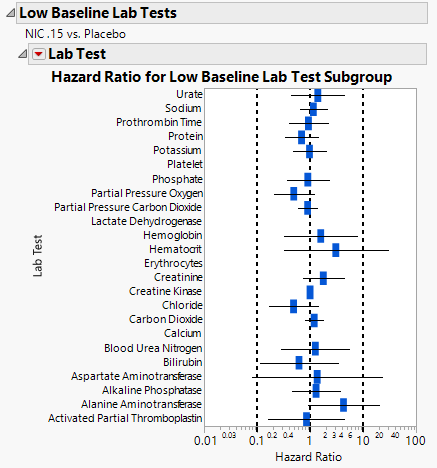
Low Baseline Lab Test
Displays a Hazard Ratio Event Plot with 95% confidence intervals for subjects showing abnormally low lab test results at baseline.
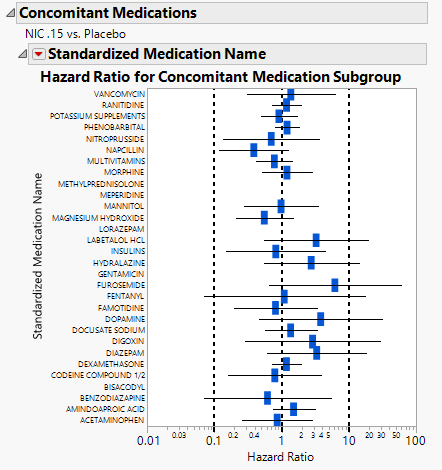
Concomitant Medications
Displays a Hazard Ratio Event Plot with 95% confidence intervals for subjects taking concomitant medications at baseline.
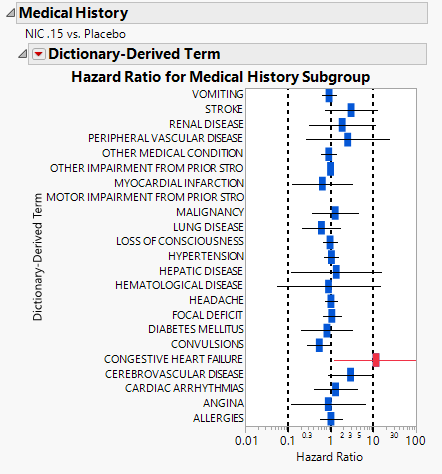
Medical History
Displays a Hazard Ratio Event Plot with 95% confidence intervals for subjects’ medical history events at baseline.
Action Buttons
Action buttons, provide you with an easy way to drill down into your data. The following action buttons are generated by this report:
| • | Profile Subjects: Select subjects and click  to generate the patient profiles. See Profile Subjects for additional information. to generate the patient profiles. See Profile Subjects for additional information. |
| • | Show Subjects: Select subjects and click  to open the ADSL (or DM if ADSL is unavailable) of selected subjects. to open the ADSL (or DM if ADSL is unavailable) of selected subjects. |
| • | Adverse Events Narrative Generation: Select subjects and click  to open the Adverse Events Narrative dialog. From this dialog, you can customize options and generate a narrative. to open the Adverse Events Narrative dialog. From this dialog, you can customize options and generate a narrative. |
| • | Create Subject Filter: Select subjects and click  to create a data set of USUBJIDs for subjects experiencing selected events, which subsets all subsequently run reports to those selected subjects. The currently available filter data set can be applied by selecting Apply Subject Filter in any report dialog. to create a data set of USUBJIDs for subjects experiencing selected events, which subsets all subsequently run reports to those selected subjects. The currently available filter data set can be applied by selecting Apply Subject Filter in any report dialog. |
General
| • | Click  to view the associated data tables. Refer to View Data for more information. to view the associated data tables. Refer to View Data for more information. |
| • | Click  to generate a standardized pdf- or rtf-formatted report containing the plots and charts of selected sections. to generate a standardized pdf- or rtf-formatted report containing the plots and charts of selected sections. |
| • | Click  to generate a JMP Live report. Refer to Create Live Report for more information. to generate a JMP Live report. Refer to Create Live Report for more information. |
| • | Click  to take notes, and store them in a central location. Refer to Add Notes for more information. to take notes, and store them in a central location. Refer to Add Notes for more information. |
| • | Click  to read user-generated notes. Refer to View Notes for more information. to read user-generated notes. Refer to View Notes for more information. |
| • | Click  to open and view the Subject Explorer/Review Subject Filter. to open and view the Subject Explorer/Review Subject Filter. |
| • | Click  to specify Derived Population Flags that enable you to divided the subject population into two distinct groups based on whether they meet very specific criteria. to specify Derived Population Flags that enable you to divided the subject population into two distinct groups based on whether they meet very specific criteria. |
| • | Click the arrow to reopen the completed report dialog used to generate this output. |
| • | Click the gray border to the left of the Options tab to open a dynamic report navigator that lists all of the reports in the review. Refer to Report Navigator for more information. |
Report Options
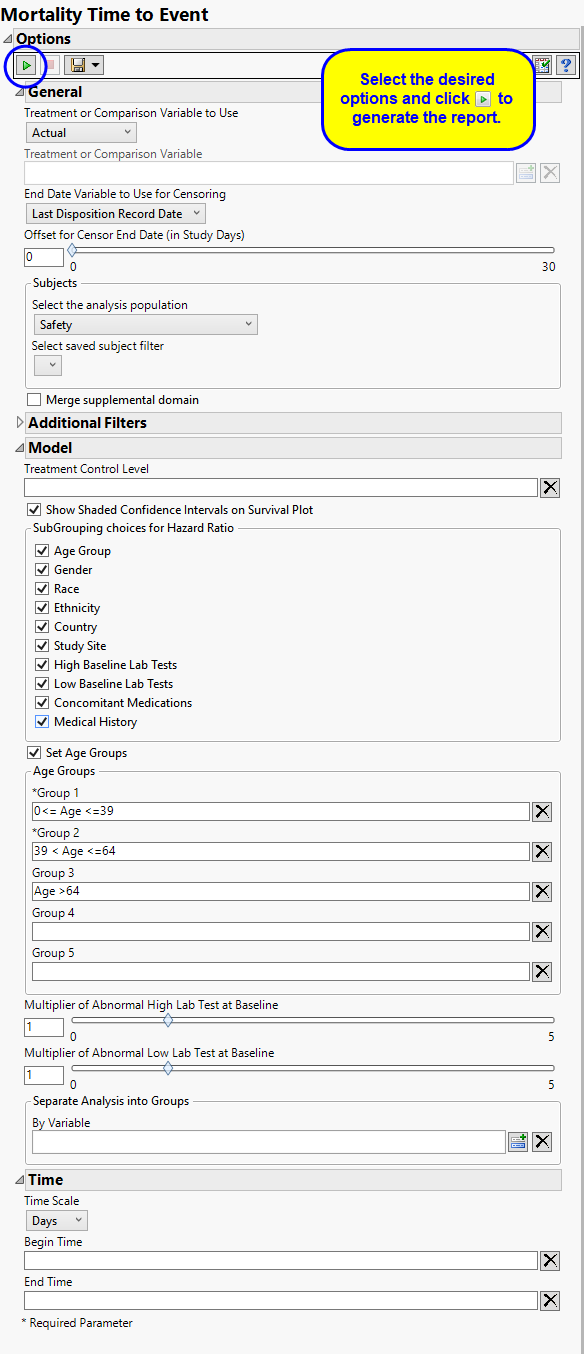
Treatment or Comparison Variable:
The primary goal of clinical trials is to distinguish treatment effects when reporting and analyzing trial results. Treatments are defined by specific values in the treatment or comparison variables of the CDISC models. These variables are specified in this report using the Treatment or Comparison Variable to Use andTreatment or Comparison Variable options.
Distributions of the specified treatment or comparison variables are shown in the output.
Available variables include Planned, which is selected when the treatments patients received exactly match what was planned and Actual, which is selected when treatment deviates from what was planned.
You can also specify a variable other than the ARM or TRTxxP (planned treatment) or ACTARM or TRTxxA (actual treatment) from the CDISC models as a surrogate variable to serve as a comparator. Finally you can select None to plot the data without segregating it by a treatment variable.
See Treatment or Comparison Variable to Use, Treatment or Comparison Variable for more information.
End Date
Use the End Date Variable to Use for Censoring option for specifying the end date for censoring. Options include the reference end date (selected by default), date of the last treatment, the date the subject left the study or the date of the last disposition record. You can use the Offset for Censor End Date (in Study Days) option to extend the analysis for an additional specified number of days.
Filtering the Data:
Filters enable you to restrict the analysis to a specific subset of subjects, based on values within variables. You can also filter based on population flags (Safety is selected by default) within the study data.
If there is a supplemental domain (SUPPDS or SUPPMH) associated with your study, you can opt to merge the non-standard data contained therein into your data.
See Select the analysis population, Select saved subject filter2, Merge supplemental domain, and Additional Filter to Include Subjects
Model
The Treatment Control Level is specified as either “Placebo” or “Pbo”, depending on the value found in your data, by default. However, if your control is defined differently you can use the text box to specify the control level is identified in your study.
Selecting the Show Shaded Confidence Intervals on Survival Plot option adds confidence intervals to the plots.
Subgrouping
These options enable you to group subjects by demographic, findings, and other characteristics for computing hazard ratios. See Age Group, Gender, Race, Ethnicity, Country, Study Site, High Baseline Lab Tests, Low Baseline Lab Tests, Concomitant Medications, and Medical History for more information.
Age Groups
Factors other than treatment can influence mortality of study subjects. For example, elderly subjects might be more likely to die during or soon after participating in the study. By default, this report does not consider subject age in the analysis. However, this report enables you to Set Age Groups in order to assess subject age on mortality rates in up to 5 age groups observed in your study. See Group 1, Group 2, Group 3, Group 4, Group 5 for more information.
You can use the Include findings domains and Multiplier of Abnormal Low Lab Test at Baseline options to set thresholds for identifying subjects with abnormally high or low baseline lab values. Subjects with values outside of these thresholds are then included in hazard ratio analyses.
You can also subdivide the subjects and run analyses for distinct groups by specifying one or more By Variables.
Time
By default, time is measured in days. However, you can change the Time Scale to measure time in weeks. This option is useful for assessing report graphics for exceptionally long studies.
You can opt to assess interventions across the entire study (specified by default). Alternatively, you can specify a Begin Time and an End Time to restrict the analysis to a specific time interval.