Adverse Events Resolution Screen
This report screens all adverse events by performing a Cochran-Mantel-Haenszel exact test (CMH exact test) on all 2 x 2 tables constructed from event resolution and treatment arm. Resolution is computed directly from the end time of an adverse event and the end time of the trial, or from a resolution time that you specify.
Report Results Description
Refer to the Adverse Events Incidence Screen report description, keeping in mind the following important report differences in contrast with the example:
| • | output (including section names) reflects adverse events resolution (resolution status is determined by Determine resolution status using:), rather than incidence. |
| • | Time Windows for Start of Adverse Event replaces Trial Time Windows |
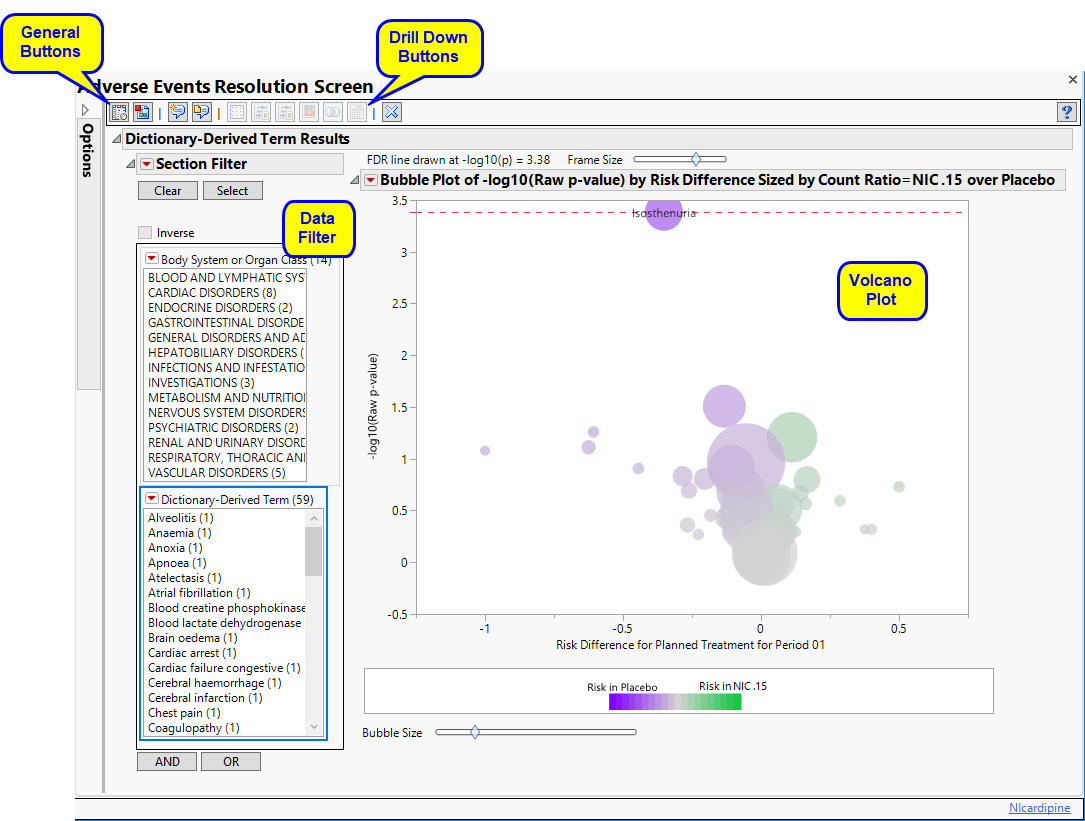
Action Buttons
Action buttons, provide you with an easy way to drill down into your data. The following action buttons are generated by this report:
| • | Dot Plot: Click  to create a dot plot for selected terms or for all terms that fall under selected groups, with rates of adverse events by treatment, the relative risk, the risk difference, and the odds ratio presented. to create a dot plot for selected terms or for all terms that fall under selected groups, with rates of adverse events by treatment, the relative risk, the risk difference, and the odds ratio presented. |
| • | Relative Risk Plot: Click  to create a relative risk plot and table for selected terms or for all terms that fall under selected groups, with rates of adverse events by treatment, the log2(relative risk) and unadjusted 95% confidence intervals (Multiple Testing Method is not applied) presented. to create a relative risk plot and table for selected terms or for all terms that fall under selected groups, with rates of adverse events by treatment, the log2(relative risk) and unadjusted 95% confidence intervals (Multiple Testing Method is not applied) presented. |
| • | Odds Ratio Plot: Click  to create a plot that shows the ratio of the odds for exhibiting a selected event/intervention to the odds for those who do not exhibit the event/intervention and it can be used to estimate the relative risk when the probability of positive response is small. to create a plot that shows the ratio of the odds for exhibiting a selected event/intervention to the odds for those who do not exhibit the event/intervention and it can be used to estimate the relative risk when the probability of positive response is small. |
| • | Contingency Analysis: Click  to create the typical treatment by event contingency table for selected terms or for all terms that fall under selected groups. to create the typical treatment by event contingency table for selected terms or for all terms that fall under selected groups. |
| • | Venn Diagram: Click  to create a Venn diagram for up to five selected terms or for terms that fall under selected groups, to show the co-occurrence of adverse events within study subject. to create a Venn diagram for up to five selected terms or for terms that fall under selected groups, to show the co-occurrence of adverse events within study subject. |
| • | Tabulate: Click  to create a table for selected terms or for all terms that fall under selected groups, showing the co-occurrence of adverse events within study subject. You can further modify the tables to show additional summary statistics. to create a table for selected terms or for all terms that fall under selected groups, showing the co-occurrence of adverse events within study subject. You can further modify the tables to show additional summary statistics. |
General
| • | Click  to view the associated data tables. Refer to View Data for more information. to view the associated data tables. Refer to View Data for more information. |
| • | Click  to generate a standardized pdf- or rtf-formatted report containing the plots and charts of selected sections. to generate a standardized pdf- or rtf-formatted report containing the plots and charts of selected sections. |
| • | Click  to generate a JMP Live report. Refer to Create Live Report for more information. to generate a JMP Live report. Refer to Create Live Report for more information. |
| • | Click  to take notes, and store them in a central location. Refer to Add Notes for more information. to take notes, and store them in a central location. Refer to Add Notes for more information. |
| • | Click  to read user-generated notes. Refer to View Notes for more information. to read user-generated notes. Refer to View Notes for more information. |
| • | Click the arrow to reopen the completed report dialog used to generate this output. |
| • | Click the gray border to the left of the Options tab to open a dynamic report navigator that lists all of the reports in the review. Refer to Report Navigator for more information. |
Note: For information about how treatment emergent adverse events (TEAEs) are defined in JMP Clinical, please refer to How does JMP Clinical determine whether an Event Is a Treatment Emergent Adverse Event?.
Note: The following notes: Multiple treatment periods have been detected and displayed. and Pre-treatment has been assigned to period=0. are inserted at the top of the report when these events are detected in your data.
Report Options
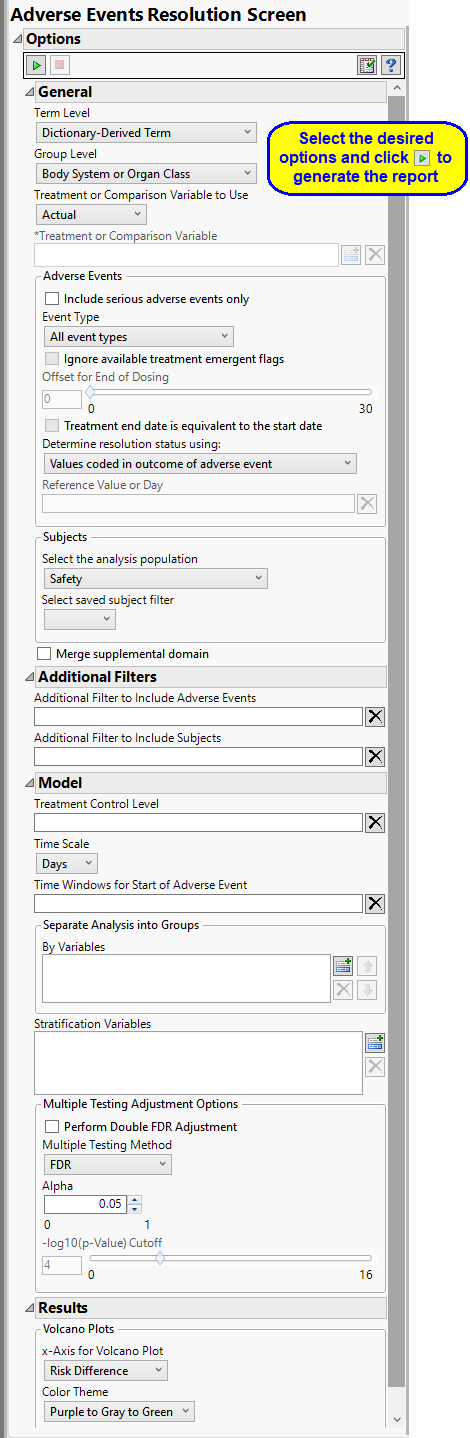
Term and Group Levels
Term and Group Levels are determined by the coding dictionary for the Event or Intervention domain of interest, typically these levels follow the MedDRA dictionary. You must indicate how each adverse event is named and the level at which the event is considered. For example, selecting Reported Term and Body System or Organ Class as the Term Level and Group Level, respectively, reports the event specified by the actual event term as reported in the AE domain on the affected organ or body system.
Treatment or Comparison Variable:
When specifying a treatment or comparison variable, a distribution of the selected variable is shown in the output and the demographic tables are categorized by the values of the variable.
Available variables include Planned, which is selected when the treatments patients received exactly match what was planned and Actual, which is selected when treatment deviates from what was planned. You can also specify any demographic variable from DM and/or ADSL as a surrogate for the treatment variables. Finally you can select None to plot the data without segregating it by a treatment variable.
See Treatment or Comparison Variable to Use, Treatment or Comparison Variable for more information.
Adverse Events
By default, all events are included in the analysis. However, you can opt to include only those considered serious. Selecting the Include serious adverse events only option restricts the analysis to those adverse events defined as Serious under FDA guidelines.
Analysis can consider all events or only those that emerge at specific times before, during, or after the trial period. For example, selecting On treatment events as the Event Type includes only those events that occur on or after the first dose of study drug and at or before the last dose of drug (+ the offset for end of dosing).
If you choose to Ignore available treatment emergent flags, the analysis includes all adverse events that occur on or after day 1 of the study.
By default, post-treatment monitoring begins after the patient receives the last treatment. However, you might want to specify an Offset for End of Dosing, increasing the time between the end of dosing and post-treatment monitoring for treatments having an extended half-life.
Check the Treatment end date is equivalent to the start date if the treatment end date (EXTENDTC) is missing from the data. In this case, it is assumed that all treatments were given on the same day and that the treatment start date can be used instead.
You must specify how to determine whether an adverse event is resolved or not resolved using the Determine resolution status using: option. You can specify either an outcome (resolved or not) or a time. A Reference Value or Day must be specified if you select one of the available time options, which include either duration of the event, or the date on which it ended.
Filtering the Data:
Filters enable you to restrict the analysis to a specific subset of subjects and/or adverse events based on values within variables. You can also filter based on population flags (Safety is selected by default) within the study data.
If there is a supplemental domain (SUPPAE) associated with your study, you can opt to merge the non-standard data contained therein into your data.
See Select the analysis population, Select saved subject filter1, Merge supplemental domain, Additional Filter to Include Adverse Events, and Additional Filter to Include Subjects for more information.
Model
The Treatment Control Level is specified as either “Placebo” or “Pbo”, depending on the value found in your data, by default. However, if your control is defined differently you can use the text box to specify the control level is identified in your study.
You can opt to assess interventions across the entire study (specified by default). Alternatively, you can use the Time Windows for Start of Adverse Event option to limit it to selected time points or intervals. By default, time is measured in days. However, you can change the Time Scale to measure time in weeks. This option is useful for assessing report graphics for exceptionally long studies.
You can also subdivide the subjects and run analyses for distinct groups by specifying one or more By Variables.
Stratification Variables segment the data into meaningful clusters and statistical tests such as the CMH exact test account for them. Such stratification is usually recommended when strata exist in your study, for example, by site.
Multiple Testing Adjustment Options
Multiple testing adjustments enable you to control both the proportion of all truly null hypothesis tests that are claimed to be significant (false positive rate) and the proportion of hypothesis tests claimed significant that are truly null (false discovery rate) for conclusions drawn across a collection of statistical tests.
You can opt to Perform Double FDR Adjustment on your data. By default, this adjustment is not performed. The Double False Discovery Rate method2 is used here to compare the incidence of interventions among treatments, leveraging the grouping of related events (typically defined by the MedDRA system organ class). The method considers whether related terms within a group show differences between the treatments and upweights or downweights the significance of an individual term within the group accordingly.
The False Discovery Rate test is selected by default. You can use the Multiple Testing Method option to select alternative test protocols.
The Alpha option is used to specify the significance level by which to judge the validity of the summary statistics generated by this report. The meaning of alpha depends on the adjustment method that you select. Alpha can be set to any number between 0 and 1, but is most typically set at 0.001, 0.01, 0.05, or 0.10. The higher the alpha, the higher the error rate but also higher the power for detecting significant differences. You will need to decide on the best trade-off for your experiment.
Note that instead of performing multiple testing adjustments of the p-values, you can opt to simply specify a cutoff value for -log10(p-values) in order to select significant hypothesis tests. Using unadjusted p-values with a cutoff has the benefit of more expansive volcano plots, whereas adjusted p-values tend to squish points along the y-axis.Refer to -log10(p-Value) Cutoff for more information. Note: This option is available only when no multiple testing method is specified.
Output
Use the x-Axis for Volcano Plot option to specify the parameter to be plotted on the x-axis of your volcano plots. The Color Theme option enables you to specify the color scheme of the report graphics.