Discontinuation Time to Event
This report creates a plot that displays the proportion of subjects who have not discontinued the study by days completed. Discontinuation events can be limited to those due to adverse events or deaths only (default) or those due to all reasons. A contingency analysis is also provided of subjects discontinued by treatment arm.
Report Results Description
Running this report for Nicardipine using default settings generates the tabbed Results shown below.
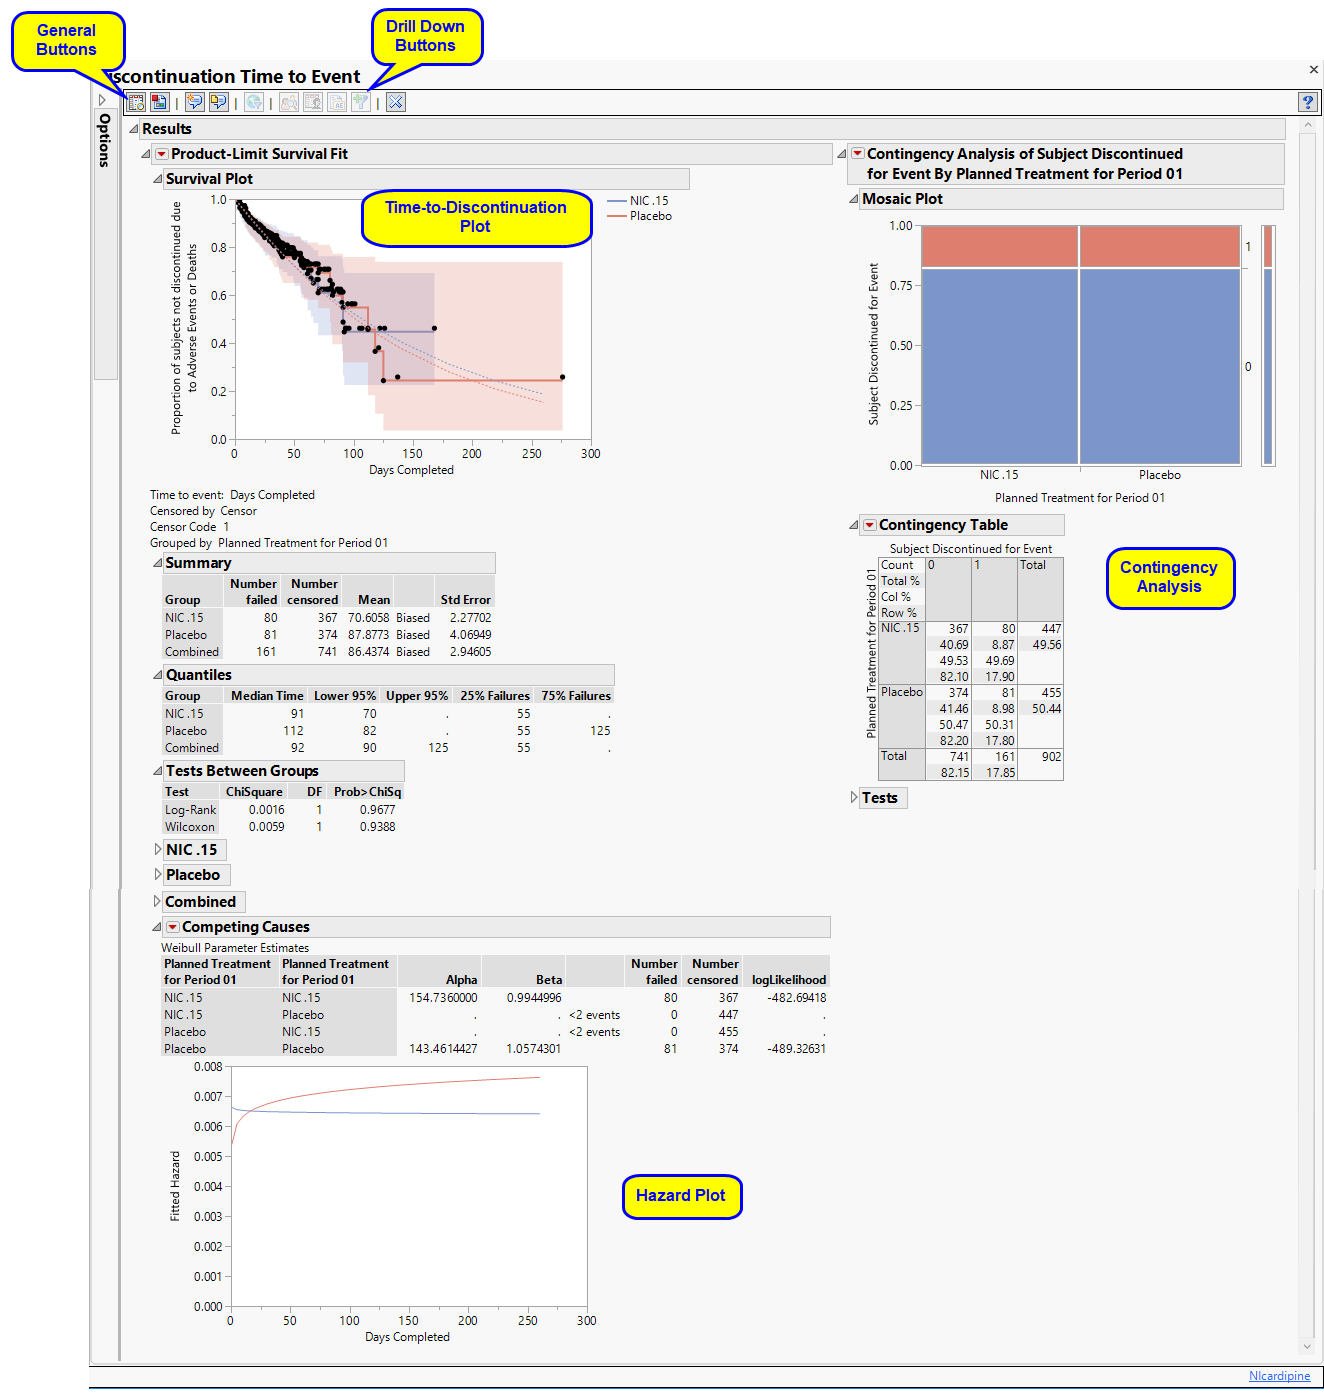
Results
Contains a Kaplan-Meier Survival Curve time-to-event analysis as well as a contingency analysis of treatment versus discontinuation status. You can define what constitutes a discontinuation using the Define events as: option in the dialog.
| • | One Time-to-Discontinuation Plot. |
This analysis compares the time until discontinuation of individuals in the study. Otherwise, subjects are censored when they complete the trial.
See Survival Plot for more information.
| • | One Contingency Table and Mosaic Plot. |
Compares treatment versus discontinuation status. This analysis ignores the time at which discontinuations occur.
See Contingency Table for more information.
| • | One Hazard Plot |
The Competing Causes section of the includes a Weibull fit and corresponding hazard plot showing treatment emergent adverse event risk over time.
Action Buttons
Action buttons, provide you with an easy way to drill down into your data. The following action buttons are generated by this report:
| • | Profile Subjects: Select subjects and click  to generate the patient profiles for subjects experiencing selected events. See Profile Subjects for additional information. to generate the patient profiles for subjects experiencing selected events. See Profile Subjects for additional information. |
| • | Show Subjects: Select subjects and click  to open the ADSL(or DM if ADSL is unavailable) of selected subjects for subjects experiencing selected events. to open the ADSL(or DM if ADSL is unavailable) of selected subjects for subjects experiencing selected events. |
| • | Adverse Events Narrative Generation: Select subjects and click  to generate an Adverse Events narrative report for the selected subjects. See Adverse Events Narrative for more information. to generate an Adverse Events narrative report for the selected subjects. See Adverse Events Narrative for more information. |
| • | Create Subject Filter: Select subjects and click  to create a data set of USUBJIDs, which subsets all subsequently run reports to those selected subjects. to create a data set of USUBJIDs, which subsets all subsequently run reports to those selected subjects. |
General
| • | Click  to view the associated data tables. Refer to View Data for more information. to view the associated data tables. Refer to View Data for more information. |
| • | Click  to generate a standardized pdf- or rtf-formatted report containing the plots and charts of selected sections. to generate a standardized pdf- or rtf-formatted report containing the plots and charts of selected sections. |
| • | Click  to generate a JMP Live report. Refer to Create Live Report for more information. to generate a JMP Live report. Refer to Create Live Report for more information. |
| • | Click  to take notes, and store them in a central location. Refer to Add Notes for more information. to take notes, and store them in a central location. Refer to Add Notes for more information. |
| • | Click  to read user-generated notes. Refer to View Notes for more information. to read user-generated notes. Refer to View Notes for more information. |
| • | Click  to open and view the Subject Explorer/Review Subject Filter. to open and view the Subject Explorer/Review Subject Filter. |
| • | Click  to specify Derived Population Flags that enable you to divided the subject population into two distinct groups based on whether they meet very specific criteria. to specify Derived Population Flags that enable you to divided the subject population into two distinct groups based on whether they meet very specific criteria. |
| • | Click the arrow to reopen the completed report dialog used to generate this output. |
| • | Click the gray border to the left of the Options tab to open a dynamic report navigator that lists all of the reports in the review. Refer to Report Navigator for more information. |
Report Options
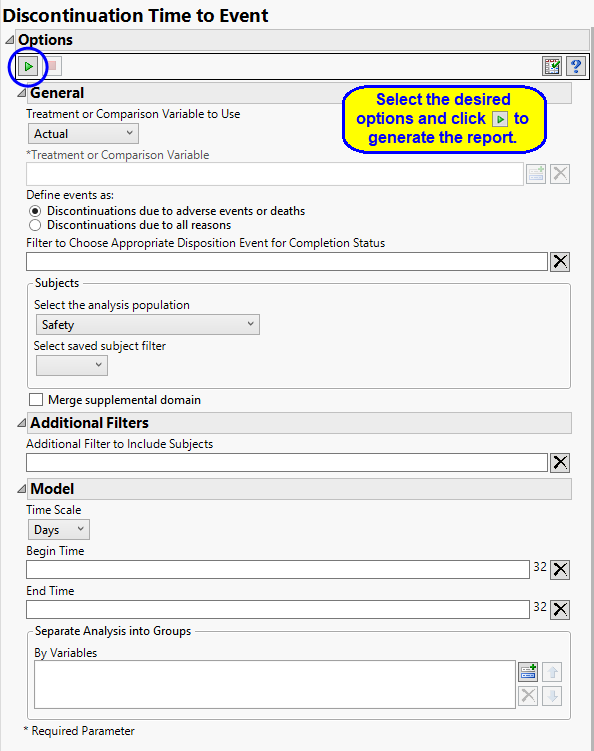
Treatment or Comparison Variable:
The primary goal of clinical trials is to distinguish treatment effects when reporting and analyzing trial results. Treatments are defined by specific values in the treatment or comparison variables of the CDISC models. These variables are specified in this report using the Treatment or Comparison Variable to Use and Treatment or Comparison Variable options.
Available variables include Planned, which is selected when the treatments patients received exactly match what was planned and Actual, which is selected when treatment deviates from what was planned.
You can also specify a variable other than the ARM or TRTxxP (planned treatment) or ACTARM or TRTxxA (actual treatment) from the CDISC models as a surrogate variable to serve as a comparator. Finally you can select None to plot the data without segregating it by a treatment variable.
See Treatment or Comparison Variable to Use, Treatment or Comparison Variable for more information.
Events
A patient may drop out of a study, or discontinue, because of a variety of reasons. It is important to consider reasons for patient s discontinuation in a study while assessing the outcome of any study. Discontinuations directly resulting from adverse events or death arising from study protocols must absolutely be considered. Others, however, are not relevant to the outcome. For example, relocation of a patient to a different city could cause the patient to discontinue, but would not be significant and can safely be excluded from the analysis. You can use the Define events as: option to differentiate between these events.
Use the option filter rows from the DS data set to choose the appropriate records to indicate final trial status (COMPLETED or WITHDRAWN/DISCONTINUED, for example). Only those rows that meet all of the conditions specified in the field are included in the analysis. There should be one record per person, but the report chooses the last if multiple are present per person. By default no text is specified and the last record where DSCAT = "DISPOSITION EVENT” is used.
Filtering the Data:
Filters enable you to restrict the analysis to a specific subset of subjects based on values within variables. You can also filter based on population flags (Safety is selected by default) within the study data.
If there is a supplemental domain (SUPPAE) associated with your study, you can opt to merge the non-standard data contained therein into your data.
See Select the analysis population, Select saved subject filter1, Merge supplemental domain, and Additional Filter to Include Subjects for more information.
Model
By default, time is measured in days. However, you can change the Time Scale to measure time in weeks. This option is useful for assessing report graphics for exceptionally long studies.
You can opt to assess interventions across the entire study (specified by default). Alternatively, you can specify a Begin Time and an End Time to restrict the analysis to a specific time interval.
You can also subdivide the subjects and run analyses for distinct groups by specifying one or more By Variables.