Disease Response Swimmer Plot
This process creates a disease response swimmer plot and tables around either the best or last recorded response rates and calculated objective response rate for solid tumor oncology clinical trials, representing RECIST evaluation from the RS domain. The output includes a swimmer plot for subjects who have responded favorably to treatment for solid lesion trials per RECIST criteria using CDISC recommended evaluation responses of Complete Response (CR), and Partial Response (PR). Optionally, subjects can be annotated with responses of Stable Disease (SD) and/or Progressive Disease (PD) as well. The results of these assessments are summarized based on selecting either the Best response per subject, based on preferred order: CR, PR, SD, PD for controlled terms, respectively, or Last recorded response. Using this summarized response, subject counts and percentages of response rates are displayed in a summary table split by Treatment Variable based on report selection. The objective response rate (the sum and percentage of subjects who had CR + PR assessment result) is also calculated and listed in the summary table.
Report Results Description
Running this report for a modified Nicardipine study using default settings generates the report shown below. The Include Stable Disease and Include Progressive Disease Response options were checked.
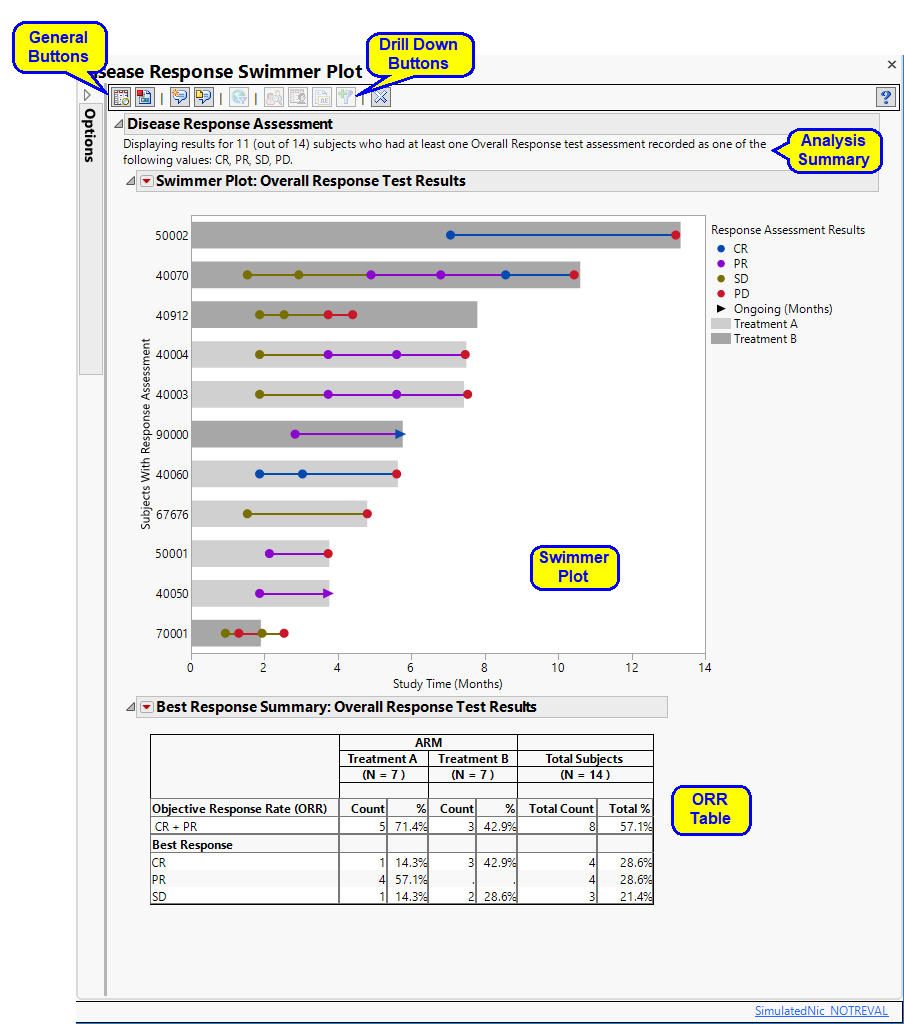
It contains the following elements:
| • | Summary text |
Summarizes the subjects plotted below.
| • | One Swimmer Plot |
The swimmer plots shows each subject’s response to treatment over the course of the study. Each bar represents one subject. Only those subjects who had at least one overall response assessment are plotted. The length of the bars correspond to the time each subject spent in the study and are colored by treatment. Reasons for leaving the study are not indicated. Response to the treatments are illustrated by the color of the dots, connecting lines, and arrows. These change color as treatment responses change.The dots indicate the time when the response was recorded. Arrows indicate ongoing response.
| • | One Objective Response Rate (ORR) Summary table |
This table lists the numbers of the subjects showing complete response (CR) and partial response (PR), as well as those with stable disease (SD) for each treatment. Subjects showing progressive disease (PD) as their best response would also be listed. The table also shows the overall response rate (CR + PR) for each treatment. Total subject counts are also displayed.
Action Buttons
Action buttons, provide you with an easy way to drill down into your data. The following action buttons are generated by this report:
| • | Profile Subjects: Select subjects and click  to generate the patient profiles. See Profile Subjects for additional information. to generate the patient profiles. See Profile Subjects for additional information. |
| • | Show Subjects: Select subjects and click  to open the ADSL (or DM if ADSL is unavailable) of selected subjects. to open the ADSL (or DM if ADSL is unavailable) of selected subjects. |
| • | Adverse Events Narrative Generation: Select subjects and click  to open the Adverse Events Narrative dialog. From this dialog, you can customize options and generate a narrative. to open the Adverse Events Narrative dialog. From this dialog, you can customize options and generate a narrative. |
| • | Create Subject Filter: Click  to create a new local subject filter. to create a new local subject filter. |
General
| • | Click  to view the associated data tables. Refer to View Data for more information. to view the associated data tables. Refer to View Data for more information. |
| • | Click  to generate a standardized pdf- or rtf-formatted report containing the plots and charts of selected sections. to generate a standardized pdf- or rtf-formatted report containing the plots and charts of selected sections. |
| • | Click  to generate a JMP Live report. Refer to Create Live Report for more information. to generate a JMP Live report. Refer to Create Live Report for more information. |
| • | Click  to take notes, and store them in a central location. Refer to Add Notes for more information. to take notes, and store them in a central location. Refer to Add Notes for more information. |
| • | Click  to read user-generated notes. Refer to View Notes for more information. to read user-generated notes. Refer to View Notes for more information. |
| • | Click  to open and view the Subject Explorer/Review Subject Filter. to open and view the Subject Explorer/Review Subject Filter. |
| • | Click  to specify Derived Population Flags that enable you to divided the subject population into two distinct groups based on whether they meet very specific criteria. to specify Derived Population Flags that enable you to divided the subject population into two distinct groups based on whether they meet very specific criteria. |
| • | Click the arrow to reopen the completed report dialog used to generate this output. |
| • | Click the gray border to the left of the Options tab to open a dynamic report navigator that lists all of the reports in the review. Refer to Report Navigator for more information. |
Report Option Descriptions
General
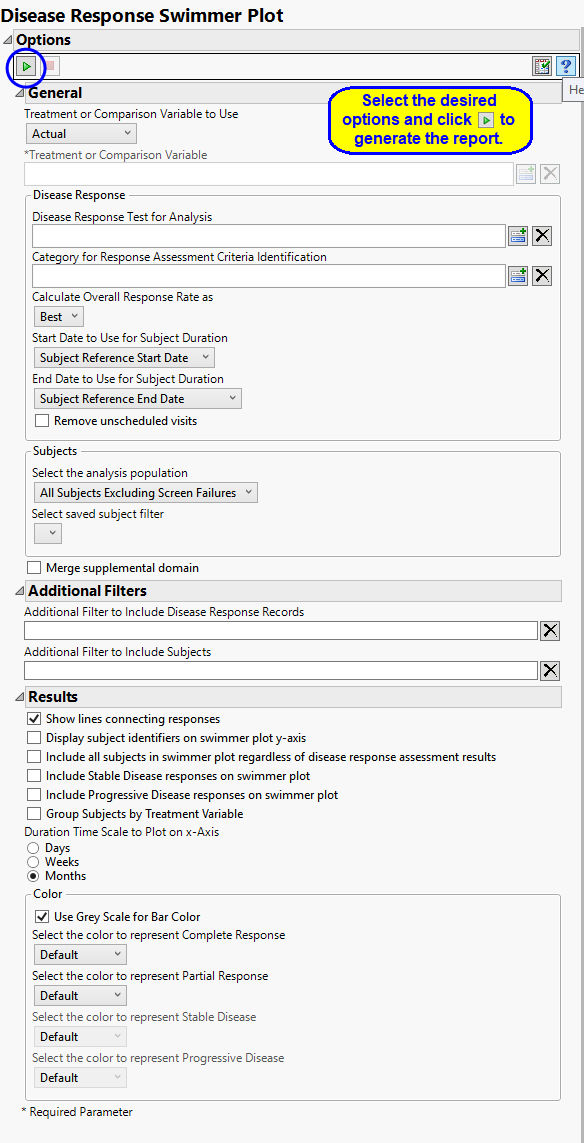
The primary goal of clinical trials is to distinguish treatment effects when reporting and analyzing trial results. Treatments are defined by specific values in the treatment or comparison variables of the CDISC models. These variables are specified in this report using the Treatment or Comparison Variable to Use and Treatment or Comparison Variable options.
Distributions of the specified treatment or comparison variables are shown in the output.
Available variables include Planned, which is selected when the treatments patients received exactly match what was planned and Actual, which is selected when treatment deviates from what was planned.
You can also specify a variable other than the ARM or TRTxxP (planned treatment) or ACTARM or TRTxxA (actual treatment) from the CDISC models as a surrogate variable to serve as a comparator.
See Treatment or Comparison Variable to Use, Treatment or Comparison Variable for more information.
Disease Response
Use the Disease Response Test for Analysis option to select the relevant test code (RSTESTCD) whose results (RSSTRESC) contain values for tracking response assessment of Complete Response, Partial Response, Progressive Disease, or Stable Disease across study visits/time points. By default, if this option is left blank the report will attempt to find and use an RSTEST value of OVERALL RESPONSE (case insensitive).
Use the Category for Response Assessment Criteria Identification option to filter/select to the specific response assessment criteria value to use for showing response assessment in the resulting swimmer plot and table. If this field is left blank or your data does not contain the expected variable RSCAT with valid values of criteria identification, all records will be considered for the given selected test or algorithmically for any test named OVERALL RESPONSE.
Use the Calculate Overall Response Rate as to select the option for which to calculate Response Rate Summaries displayed in the table for each subject. Choose Best to select a representative response that indicates the best response a patient had recorded at any time during response assessment using preferential logic of CR, PR, SD, PD order. Choose Last to take the last response assessment recorded for each subject. Note: If multiple responses are observed at the final visit, the best among them is reported.
You must specify the start and end dates for collecting data to assess response of patients to the treatments. The Start Date to Use for Subject Durationand End Date to Use for Subject Duration options is used to select which variable date reference from the demography domain to use for calculating the response duration.
Unscheduled Visits
Unscheduled visits can occur for a variety of reasons. By default, these are excluded from this analysis. However, by unchecking the Remove unscheduled visits box, you have the option of including them.
Filtering the Data:
Filters enable you to restrict the analysis to a specific subset of subjects and/or disease records, based on values within variables. You can also filter based on population flags within the study data.
If there is a supplemental domain (SUPPXX) associated with your study, you can opt to merge the non-standard data contained therein into your data.
See Select the analysis population, Select saved subject filter, Merge supplemental domain, Include the following findings records:. Additional Filter to Include Disease Response Records, and Additional Filter to Include Subjects for more information.
Results
Checking the Show lines connecting the responses connects the observations with lines.
By default, subject identifiers are not included on the swimmer plots. Click the Display subject identifiers on swimmer plot y-axis box to display the subject identifiers on the y-axes of the plots.
By default, neither stable nor progressive disease responses are included on the swimmer plots. You can include these responses by checking the Include Stable Disease responses on swimmer plot and Include Progressive Disease responses on swimmer plot options respectively. You can include all subjects, regardless of disease response by checking the Include all subjects in swimmer plot regardless of disease response assessment results option.
Swimmer plots are presented in order of longest to shortest time subjects have participated in the study, irrespective of treatment. The Group Subjects by Treatment Variable option enables you to group and color-code subjects by treatment.
Use the Duration Time Scale to Plot on x-Axis option to select the time unit scale (Days, Weeks, or Months) to plot on the X-axis for the swimmer plot for the duration of response evaluation.
Color Options
You have the option to set the colors of the bars and response markers on the swimmer plot. See Use Grey Scale for Bar Color, Select the color to represent Complete Response, Select the color to represent Partial Response, Select the color to represent Stable Disease, and Select the color to represent Progressive Disease for more information.