Resource Center
Uncover the latest trends and industry best practices in your field
Chemical
-
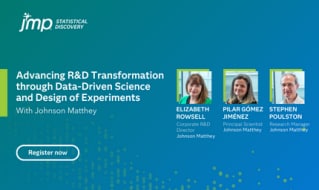 Advancing R&D Transformation through Data-Driven Science and Design of ExperimentsLearn how change agents at Johnson Matthey developed a coalition of support for data-driven science.
-
 Why the making stuff mindset doesn't make senseDOE expert Phil Kay discusses how design of experiments, and a little planning, can help you run projects that are more efficient, predictable and deliver the data you need to make better decisions.
-
 Johnson Matthey: Building organizational consensus around the tools of digital chemistryThis one-hour, webinar offers rare insight into how chemists and scientific leaders can more effectively work together to build consensus and lay the foundations for digital chemistry’s implementation.
-
 BASF + KU LeuvenHow BASF identified a gap in engineering education, then designed a course to fill it with KU Leuven.
-
 Novozymes HackathonHow Novozymes harnessed collaboration to spread analytic thinking across an organization.
Consumer Products
-
 NikeWhy the democratization of analytics at Nike Air Manufacturing Innovation is helping redefine the boundaries of sport.
-
 P&GZhiwu Liang on maximizing value from an investment in JMP.
-
 HP HoodMoving toward widespread statistical enablement, Hood accelerated R&D and deepened product knowledge.
-
 Accelerating R&D for the Autonomous and Electric Vehicles IndustryJMP provides researchers in the Autonomous and Electric Vehicles Industry strategic advantages like improved productivity, higher quality, reduced time to market and continuous process improvement.
-
 DairygoldA dynamic process-enabling tool helps develop the analytics capability of the whole organization.
Pharmaceutical
-
 PharmaronAn interview with Amy Hawksworth, Senior Manager of Downstream Process Sciences
-
 Tracking and Trending Metrics in the Pharma and Biotech IndustryIn this on-demand webinar, you'll learn how to use process monitoring to know when to react to variation and how to differentiate the signals from the noise.
-
 CDISC Enables Efficient Streamlining of Clinical Trial Safety EvaluationIn this paper we discuss clinical trial summary information and follow the flow of FDA New Drug Application (NDA) submissions, Clinical Reviews (CR) and Biosimilar Multi-disciplinary Evaluation and Review (BMER) to reveal how the various domains of SDTM and ADaM are used to assess drug safety.
-
 Rentschler BiopharmaA culture of data literacy encourages scientists to embrace digitalization.
-
 Ingolstadt University of Applied Sciences: Maximizing the Value of Industrial Data through the Integration of Machine Learning and Data AnalyticsWatch this video and find guidance and stories about how to get started with Machine Learning techniques or effectively integrate them within existing programs that seek to make the most of your data and drive more value for your organization.
Semiconductor
-
 NXP ReliabilityAdvanced analytics practices honed through NXP's Citizen Data Scientist Program solve business-critical reliability challenges.
-
 Murata FinlandAnalytics enablement drives innovation forward.
-
 Murata Electronics: Leveraging Data skills to drive Innovation and Quality across your organizationWatch this video and hear from industry leaders to learn how they have evolved into a culture of analytics. You will be inspired to forge a similar path within your own organization.
-
Ingolstadt University of Applied Sciences: Maximizing the Value of Industrial Data through the Integration of Machine Learning and Data AnalyticsWatch this video and find guidance and stories about how to get started with Machine Learning techniques or effectively integrate them within existing programs that seek to make the most of your data and drive more value for your organization.
-
 Micron TechnologyEnterprise analytics enablement drives innovation.
Biotech
-
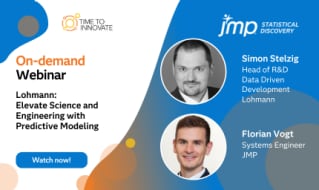 Lohmann: Elevate Science and Engineering with Predictive ModelingWatch this video and get the knowledge and tools you need to make data-driven decisions using Predictive Modeling.
-
PharmaronAn interview with Amy Hawksworth, Senior Manager of Downstream Process Sciences
-
 Miltenyi Biotec: Mastering Decision-Making in Process Engineering: An Exploration of Design of ExperimentsWatch this video and get the knowledge and tools you need to make data-driven decisions using DOE.
-
Tracking and Trending Metrics in the Pharma and Biotech IndustryIn this on-demand webinar, you'll learn how to use process monitoring to know when to react to variation and how to differentiate the signals from the noise.
-
Rentschler BiopharmaA culture of data literacy encourages scientists to embrace digitalization.
Clean Energy and Conservation
-
 Coral Reef DiagnosticsPredictive modeling in the race to preserve coral reefs.
-
 Universidade de Trás-os-Montes e Alto DouroA forest scientist discusses silvicultural simulations and the joy of modeling.
-
 McMaster UniversityBiologist Patricia Chow-Fraser on predicting patterns in ecosystem health.
-
 Revolutionizing Sustainability Through Green ChemistryJoin us for a virtual discussion with Grace Lasker and Rick Morgan on sustainability through green chemistry.
-
 Target MalariaCapacity-building efforts accelerate research outputs in novel vector control approaches towards disease transmission.
Government
-
 Data Science is a Team SportProfessor Alyson Wilson discusses how, as data grows in volume, velocity, variety and veracity, solving complex problems can no longer be done in a silo.
-
 Intentional visualizations help untangle complex dataFrom policy to sports to environmental investigations — data visualization leads to insights
-
 Mission-critical advanced statistics for the defense communityLearn about machine learning and artificial intelligence, and their synergies with structured experimentation
-
 Leveraging Free Text Data to Build Better ModelsLearn how text data can be combined with non-text data to build better models and make better decisions.
-
 Stay relevant and competitive with modern quality engineeringLos Alamos National Lab, Siemens Healthineers and Wolfspeed embrace automation and the rise of the digital economy
Industrial Manufacturing
-
 PirelliThe consolidation of data workflows into a single, customized platform accelerates process innovation.
-
 TimkenSteelHow TimkenSteel used Industry 4.0 ideas to revolutionize procurement, supply chains and inventory management.
-
 W. L. Gore & AssociatesStatistician John Szarka on JMP Pro and joining the JMP Early Adopter program.
-
 Siemens HealthineersLevannia Lildhar on data literacy and her evolution from product engineering to data science.
-
 W. L. Gore & AssociatesKira Alhorn on how Gore derives business value from working with JMP Development.
Medical Devices
-
 Genomic Analysis with JMP ProJMP Pro includes many enhancements to efficiently handle large wide tables with hundreds of thousands of columns and thousands of rows, making it the perfect tool for genomic analysis. Learn more with e-book from JMP Support.
-
 BIOTRONIKStatistician Gerd Kopp on building a relationship with the JMP organization.
-
 Johnson & Johnson VisionFrom process engineer to leader in analytics enablement.
-
Siemens HealthineersLevannia Lildhar on data literacy and her evolution from product engineering to data science.
-
 Imperial College LondonResearchers developed and validated a reagent- and instrument-agnostic SARS-CoV-2 diagnostic assay within nine weeks.
Medical Statistics
-
 Colorado Department of Public Health and EnvironmentAn epidemiologist uses data analysis to help patients living with HIV/AIDS reenter the care continuum.
-
 Beijing Children's HospitalData visualization software deepens collaborations between clinicians and statisticians.
-
 Tsukuba Medical CenterTsukuba Medical Center Hospital established a model for predicting the economic life of portable medical devices (infusion pumps) using the statistical analysis tool "JMP".
Academic
-
BASF + KU LeuvenHow BASF identified a gap in engineering education, then designed a course to fill it with KU Leuven.
-
Universidade de Trás-os-Montes e Alto DouroA forest scientist discusses silvicultural simulations and the joy of modeling.
-
 University of Hawaiʻi at MānoaOn analyzing text data from Twitter to gauge public sentiment.
-
McMaster UniversityBiologist Patricia Chow-Fraser on predicting patterns in ecosystem health.
-
Target MalariaCapacity-building efforts accelerate research outputs in novel vector control approaches towards disease transmission.