리소스 센터
과학자, 엔지니어, 기타 데이터 탐색가들이 JMP를 통해 세상을 바꾸고 있는 방식을 알아보십시오
-
- 적용 분야별로 필터링
- 실험계획법(DOE)
- 데이터 시각화 및 탐색적 데이터 분석
- 품질 엔지니어링, 신뢰성 및 식스 시그마
- 통계, 예측 모형화 및 데이터 마이닝
- 소비자 및 시장 조사
- 대시보드 구축
- 생명 과학
- 교육
- Application Development
- 훌륭한 분석 문화
-
 제주반도체일체형 통계 워크플로는 연구개발(R&D) 중심 비즈니스 모델의 영향을 최적화하기 위한 핵심 요소입니다
-
 Minitab에서 JMP로: 전환 가이드, 버전 2이 가이드에서는 기술 통계와 시각화 처리에 있어 Minitab과 JMP가 어떻게 다른지 설명합니다. Minitab v19에서 JMP 16과 JMP Pro 16으로 쉽게 전환할 수 있도록 돕기 위한 안내서로, 사용자 인터페이스, 도구 액세스 방법, 분석 수행 방법, 패키지의 일반적인 워크플로를 안내합니다.
-
 셀트리온설계기반 품질고도화(QbD, Quality by Design)로 안전성과 경제성을 향상시키며 규제를 준수합니다.
-
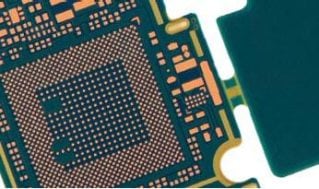
 대덕전자분석역량을 키워 비용을 줄이고 제조공정을 합리화하는 대덕전자.
-
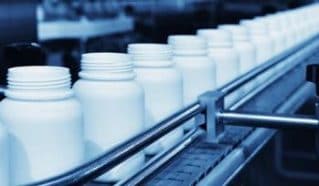
 대웅제약QbD와 DoE를 JMP를 통해 구현함으로써, 대웅제약은 경쟁이 치열한 글로벌 시장에서 한발 더 앞서 나갈 수 있었습니다.
-
 NXPJMP Pro는 솔루션 설계 및 제조, 식스 시그마 훈련 및 공정 개선을 지원합니다.
-
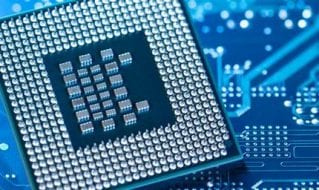
 SK 하이닉스반도체 대기업 SK 하이닉스, 기계 학습을 통해 기술 개발 효율성 창출
-
 Anatune화학자들은 DOE를 이용하여 화학 분석용 맞춤형 로봇 솔루션을 설계합니다.
-
 Houston Astros지기만 하던 야구팀이 분석으로 경쟁력을 되찾은 이야기입니다.
-
 Medytox한국의 한 선도 제약사가 '내부 인프라 강화와 임상의 질 개선'으로 세계 시장에 도전하고 있습니다.
-
 SPSS에서 JMP로: 전환 가이드이 가이드에서는 기술 통계와 시각화 처리에 있어 SPSS와 JMP가 어떻게 다른지 설명합니다. 이 가이드는 사용자가 SPSS 버전 27에서 JMP 16과 JMP Pro 16으로 쉽게 전환할 수 있도록 도와 줍니다.
-
 JMP 시너지 효과: JMP 및 JMP Pro를 파이썬 및 R과 함께 사용하기 JMP를 오픈 소스 도구와 함께 사용하고 싶거나 또는 그래야만 하는 경우가 생길 수 있습니다. 이 문서는 JMP에서 파이썬과 R 커넥션 사용을 시작할 수 있도록 도와줍니다.
-
 데이터 분석을 통해 변화를 일으키려면 무엇이 필요할까요?SAS Advanced Analytics Lab 책임자 정진환 - 좋은 분석 결과만으로 부족한 이유
-
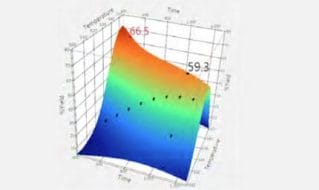 실험계획법(DOE)을 사용한 공정 최적화실험계획법(DOE)이란 무엇이며 어떻게 가치를 제공합니까? 사례 연구를 통해 이 백서는 이러한 질문에 대한 답을 제공합니다.
-
 JMP 실험계획법의 장점이 백서에서는 JMP가 제공하는 최첨단 DOE 기능에 대해 자세히 설명합니다.이 기능을 통해 특정 문제 및 리소스 제한에 맞게 설계를 조정할 수 있습니다.
-
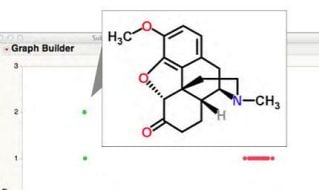
 QbD(Quality by Design) 방법을 사용한 의약품 생산 공정 최적화이 백서는 제약 제조 프로세스의 설계, 개발 및 모니터링에서 품질 관리 방식을 사용하는 방법을 보여줍니다.
-
 신은 주사위 놀이를 하지 않는다데이비드 핸드(David Hand)의 저서 <신은 주사위 놀이를 하지 않는다: 로또부터 진화까지, 우연한 일들의 법칙>의 무료 챕터를 다운로드하십시오.
-
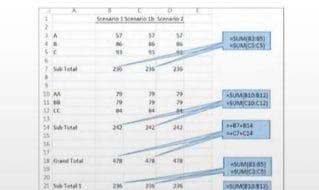
 통계 모형을 사용한 공정 개선문제에 어떻게, 언제 그리고 어디에서 통계 모델링을 적용합니까? 이 두 가지 실제 사례 연구에서 알아보십시오.
-
 Telefonica마케터는 JMP 대시보드를 이용해 소비자의 행동을 더욱 면밀하게 파악합니다.
-
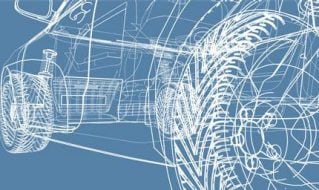 브리지스톤타구 야마모토는 개발 기간을 획기적으로 단축할 수 있도록 JMP 의 확대 사용을 브리지스톤의 개발 센터를 설득하였다.
-
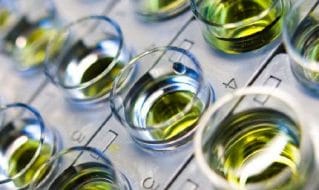
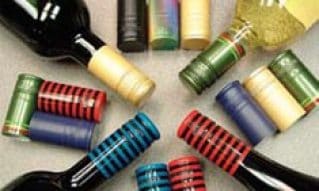 G3 엔터프라이즈나파 밸리의 G3 엔터프라이즈는 JMP를 사용해 이상적인 와인 병 마개를 테스트합니다.
-
 STMicroelectronicsSTMicroelectronics 엔지니어들은 간편하고 효율적인 동력원을 찾아냈습니다.
-
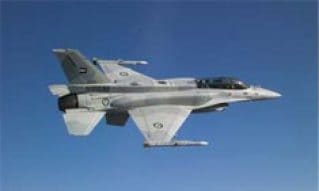 록히드 마틴록히드 마틴 엔지니어들의 항공기 이륙소음 문제해결을 위한 통계적 접근
-
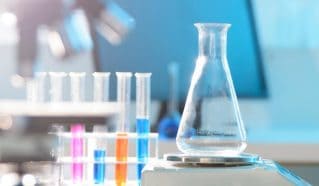
 BASFJMP, 화학자들과 함께 인산염 대체 물질을 찾는 데 일조
-
 비쉐이(Vishay)JMP의 맞춤형 분석 워크플로를 통해 엔지니어링 인재의 활용율 증대 및 비용 절감 실현
-
 얀센과학자들은 R&D 프로세스에서 잠재적인 부작용을 더 잘 감지하고 평가하기 위한 도구를 구축합니다.
-
 IpsenIpsen의 생물학자들은 새로운 암 치료제 개발의 핵심 요소인 생물지표를 연구합니다.
-
 Almirall데이터 전문가는 의료 모니터링과 준법을 위한 데이터 관리 표준을 구축합니다.
-
 Atotech엔지니어는 급변하는 산업의 요구에 맞서 DOE로 대응합니다.
-
 J. Walter Thompson브랜드 대행사인 J. Walter Thompson은 JMP Pro를 통해 책임, 참여 및 매출을 견인합니다
-
 ASM InternationalASM은 효율과 효과를 높이기 위해 통계 방법을 전사적으로 이용합니다.
-
 Johnson MattheyJohnson Matthey 공정 최적화의 ‘활력소’가 된 JMP
-
 Cal Poly Department of Industrial and Manufacturing EngineeringCal Poly의 교수진은 다문화적 사고 체계를 갖춘 미래의 엔지니어를 육성하고 있습니다. Cal Poly의 성공 사례를 살펴보십시오.
-
 SynbiCITEImperial 대학에서 합성생물학을 연구하는 SynbiCITE 에게 통계적 분석은 최신 연구를 위한 지식 분야가 되었다
-
 PerrigoPerrigo는 실험과 테스팅에 통계적 분석시스템을 적극적으로 도입함으로써 제품변동성과 기타 비효율적인 문제들을 해결하고 있습니다.
-
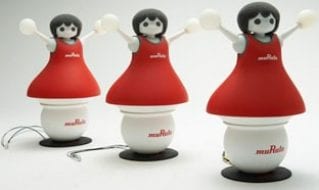 MurataJMP와 혁신적인 사고방식을 적용해 첨단 전자제품을 개발하는 엔지니어들
-
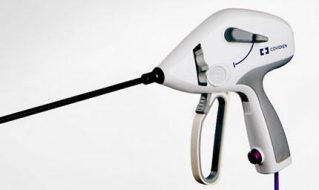 Medtronic통계에 정통한 Medtronic의 R&D 팀은 새롭고 반복이 용이한 의료 기기 성능 평가 방법론을 개발합니다.
-
 University of Michigan M. Ross School of Business미시간대학교 Stephen M. Ross 경영대학의 학생들은 JMP 통계 소프트웨어의 가치를 높게 평가합니다.
-
 Oshkosh Corporation엔지니어가 텍스트 분석으로 고객 지원 시스템을 근본적으로 변혁합니다.
-
 미국 해병대미국 해병대, 데이터 분석을 통해 수십억 달러를 절약하다.
-
 WildTrack보호 활동가들은 JMP를 사용하여 발자국을 추적하여 멸종 위기에 놓인 야생 동물을 검열합니다.
-
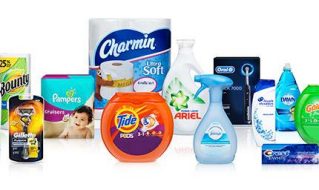 P&G정량적인 연구를 하는 과학자들이 P&G의 대표적인 소비자 브랜드를 개선하기 위하여 통계를 사용
-
 W.L. Gore Japan방수 소재 개발을 통해 혁신에 박차를 가하고 있는 Gore Japan 엔지니어
-
 지멘스 헬시니어스품질 엔지니어는 혁신적인 혈액 분석 시스템의 제조, 테스트 및 성능을 최적화합니다.
-
 Roche로슈(Roche)는 전문 의료인들이 환자의 침상 옆에서 우수한 혈액 판독값을 얻을 수 있는 바이오센서를 공급합니다.
-
 CoherentCoherent는 린 제조 원칙과 종합 데이터 분석으로 치열한 경쟁을 헤쳐나가고 있습니다.
-
 Kodak불량률 제로를 향한 Kodak의 노력에 힘을 실어준 JMP
-
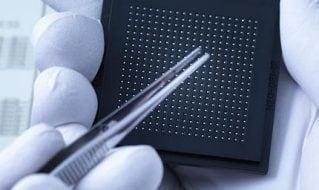
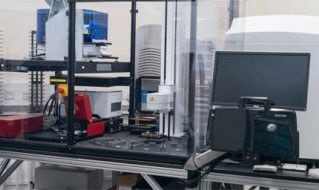 London DNA FoundryLondon DNA Foundry, JMP 실험 자동화의 계기를 열다
-
 NovomerNovomer에 최적화 체계를 마련해 준 JMP®의 실험 계획
-
 Eastman ChemicalJMP 및 JMP Pro는 통계 전문가 팀이 대화식으로 데이터에 참여하고 내부 고객과 통찰력을 공유 할 수있게합니다.
-
 성균관대학교연구원들은 JMP를 사용하여 산학 파트너인 POSCO를 위한 맞춤형 머신러닝 기술을 개발하고 적용합니다.
-
 Valard Construction데이터 과학자가 JMP로 인력 모델을 개발하여 직원 생산성을 최적화합니다.
-
 Roche 영국미래 지향적인 통계 모니터링 프로그램이 원활하고 정확한 규제 절차를 약속합니다