Treatment Emergent Adverse Events Summary
This report creates tabular and graphical overviews of treatment emergent adverse events in the study by treatment arm.
Note: For information about how treatment emergent adverse events (TEAEs) are defined in JMP Clinical, please refer to How does JMP Clinical determine whether an Event Is a Treatment Emergent Adverse Event?.
Report Results Description
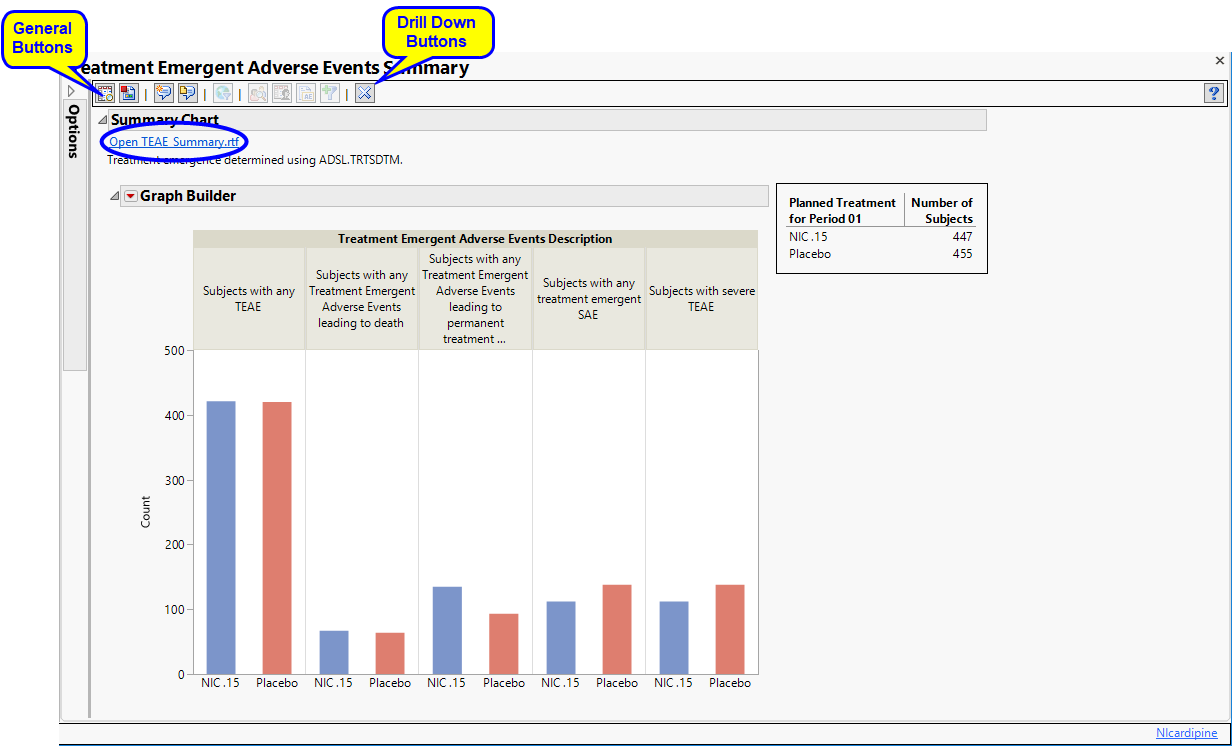
Running Treatment Emergent Adverse Events Summary for Nicardipine using default settings generates the Report shown below.
The following sections are generated by this report:
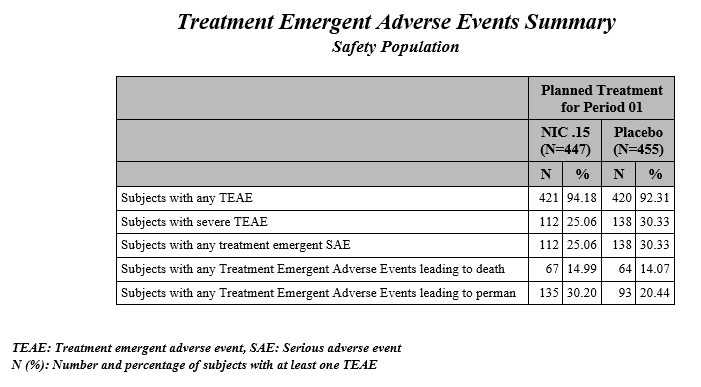
| • | Summary Chart: This section contains a Bar Chart summarizing the counts of various treatment emergent adverse events by treatment. Click the Open TEAE Summary.rtf link to open an rtf file (shown below) that summarizes the treatment emergent adverse events. Percentages of subjects experiencing an event by arm are also included in this summary. |
Action Buttons
Action buttons, provide you with an easy way to drill down into your data. The following action buttons are generated by this report:
| • | Profile Subjects: Select subjects and click  to generate the patient profiles for subjects experiencing selected events. See Profile Subjects for additional information. to generate the patient profiles for subjects experiencing selected events. See Profile Subjects for additional information. |
| • | Show Subjects: Select subjects and click  to open the ADSL (or DM if ADSL is unavailable) of selected subjects for subjects experiencing selected events. to open the ADSL (or DM if ADSL is unavailable) of selected subjects for subjects experiencing selected events. |
| • | Adverse Events Narrative Generation: Select subjects and click  to open the Adverse Events Narrative dialog. From this dialog, you can customize options and generate a narrative. to open the Adverse Events Narrative dialog. From this dialog, you can customize options and generate a narrative. |
| • | Create Subject Filter: Select subjects and click  to create a data set of USUBJIDs for subjects experiencing selected events, which subsets all subsequently run reports to those selected subjects. The currently available filter data set can be applied by selecting Apply Subject Filter in any report dialog. to create a data set of USUBJIDs for subjects experiencing selected events, which subsets all subsequently run reports to those selected subjects. The currently available filter data set can be applied by selecting Apply Subject Filter in any report dialog. |
General
| • | Click  to view the associated data tables. Refer to View Data for more information. to view the associated data tables. Refer to View Data for more information. |
| • | Click  to generate a standardized pdf- or rtf-formatted report containing the plots and charts of selected sections. to generate a standardized pdf- or rtf-formatted report containing the plots and charts of selected sections. |
| • | Click  to generate a JMP Live report. Refer to Create Live Report for more information. to generate a JMP Live report. Refer to Create Live Report for more information. |
| • | Click  to take notes, and store them in a central location. Refer to Add Notes for more information. to take notes, and store them in a central location. Refer to Add Notes for more information. |
| • | Click  to read user-generated notes. Refer to View Notes for more information. to read user-generated notes. Refer to View Notes for more information. |
| • | Click  to open and view the Subject Explorer/Review Subject Filter. to open and view the Subject Explorer/Review Subject Filter. |
| • | Click  to specify Derived Population Flags that enable you to divided the subject population into two distinct groups based on whether they meet very specific criteria. to specify Derived Population Flags that enable you to divided the subject population into two distinct groups based on whether they meet very specific criteria. |
| • | Click the arrow to reopen the completed report dialog used to generate this output. |
| • | Click the gray border to the left of the Options tab to open a dynamic report navigator that lists all of the reports in the review. Refer to Report Navigator for more information. |
Report Options
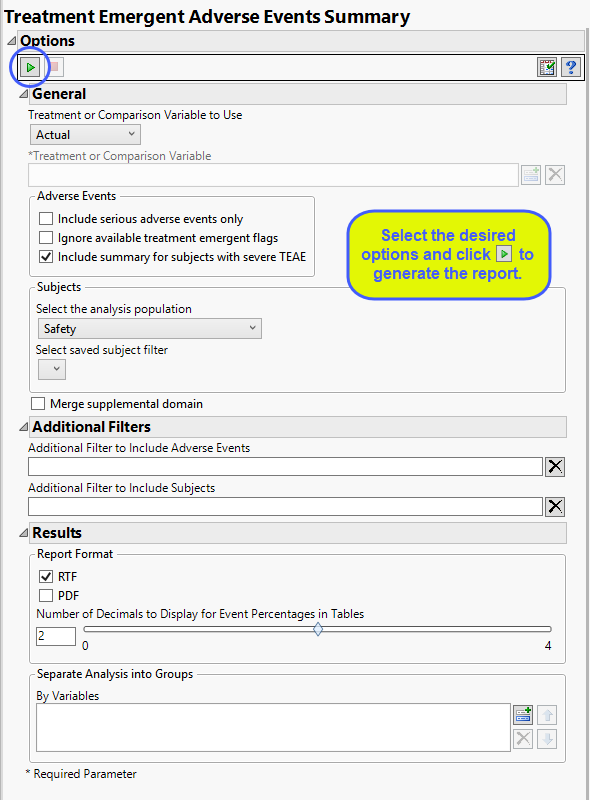
Treatment or Comparison Variable:
When specifying a treatment or comparison variable, a distribution of the selected variable is shown in the output and the demographic tables are categorized by the values of the variable.
Available variables include Planned, which is selected when the treatments patients received exactly match what was planned and Actual, which is selected when treatment deviates from what was planned. You can also specify any demographic variable from DM and/or ADSL as a surrogate for the treatment variables. Finally you can select None to plot the data without segregating it by a treatment variable.
See Treatment or Comparison Variable to Use, Treatment or Comparison Variable for more information.
Adverse Events
By default, all events are included in the analysis. However, you can opt to include only those considered serious. Selecting the Include serious adverse events only option restricts the analysis to those adverse events defined as Serious under FDA guidelines.
Note: JMP Clinical preferentially uses AETOXGR over AESEV when assessing for severity. An AETOXGR value greater than or equal to 3 is used to flag an event as severe.
If you choose to Ignore available treatment emergent flags, the analysis includes all adverse events that occur on or after day 1 of the study.
By default, the summary table and chart includes, by treatment patients with any TEAE, patients with any treatment emergent serious AE, patients with any TEAE leading to death, patients with any TEAE leading to permanent treatment discontinuation. Checking the Include summary for subjects with severe TEAE option also includes patients with severe TEAE.
Filtering the Data:
Filters enable you to restrict the analysis to a specific subset of subjects and/or adverse events, based on values within variables. You can also filter based on population flags (Safety is selected by default) within the study data.
If there is a supplemental domain (SUPPDS or SUPPMH) associated with your study, you can opt to merge the non-standard data contained therein into your data.
See Select the analysis population, Select saved subject filter1, Merge supplemental domain, Additional Filter to Include Adverse Events, and Additional Filter to Include Subjects
Results
You can use the output options to specify the format (RTF or PDF) of the final report as well as the Number of decimals to display for event percentages in tables.
You can also subdivide the subjects and run analyses for distinct groups by specifying one or more By Variables.