DSUR/PSUR Report
The DSUR/PSUR Report is used to generate a report for updating regulatory agencies regarding the safety of a clinical trial design and execution for the purpose of securing permission for the continuance of the trial..
Report Results Description
Running DSUR/PSUR Report for the Nicardipine study using default settings, generates the Report shown below.
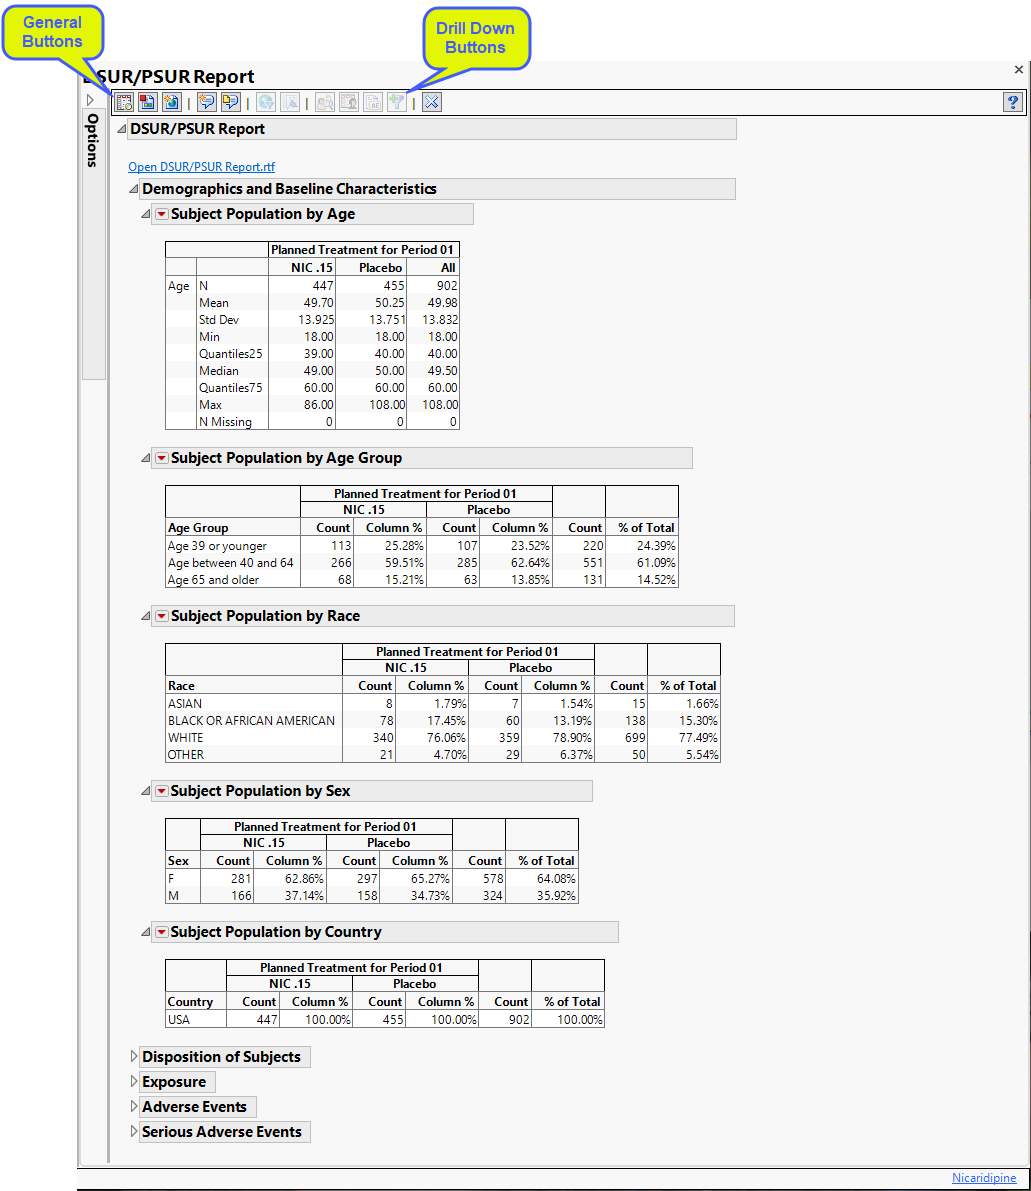
The Report contains the following elements:
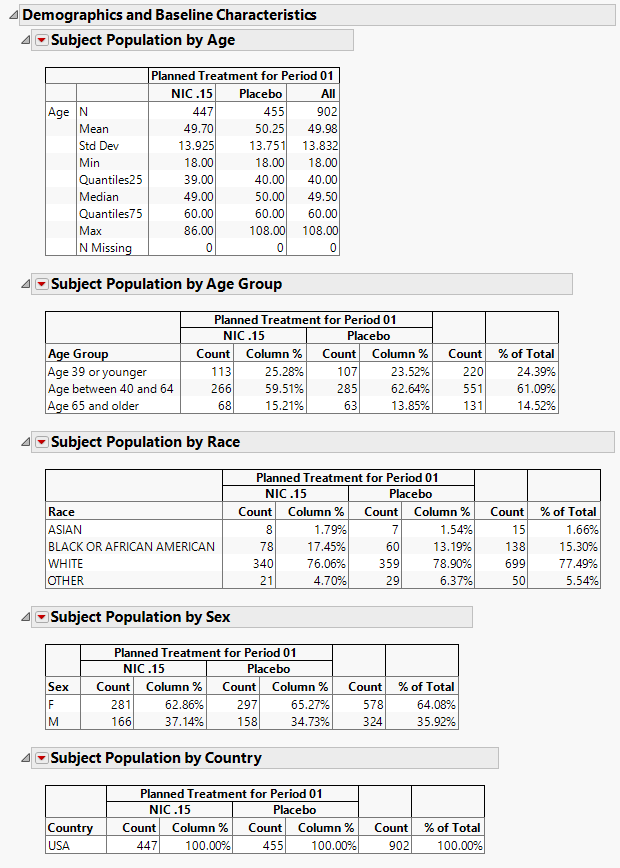
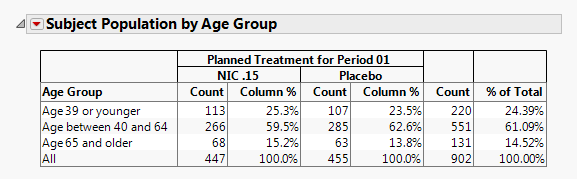
Demographics and Baseline Characteristics
The tables in this section (shown below) summarize demographic information about the subjects in this study. Both count and percentile data are provided by treatment arm.
Disposition of Subjects
The table in this section (shown below) summarizes disposition information about the subjects in this study. Both count and percentile data are provided for each disposition event broken out by treatment arm.
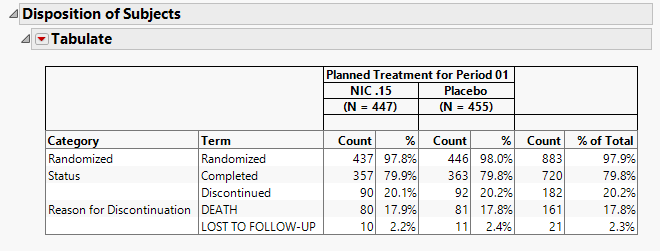
The order of variables selected to use for Randomization of the disposition table order is as follows: first RANDFL, then RAND, then RANDOMIZED, then either RANDOM, or RANDDT in ADSL or DM. If none of those variables exist, look in DS for records where DSDECOD=RANDOMIZED.
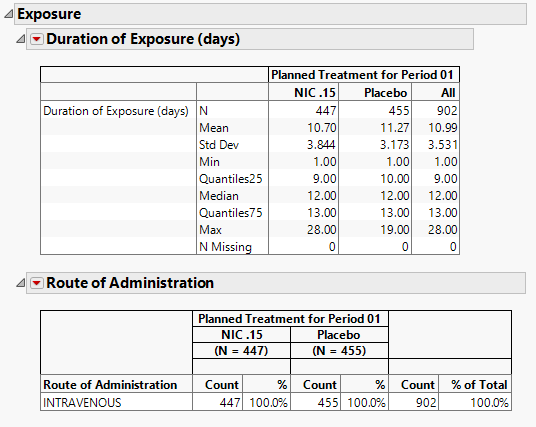
Exposure
The tables in this section (shown below) summarize length of exposure by treatment arm. Treatment administration methods are also summarized.
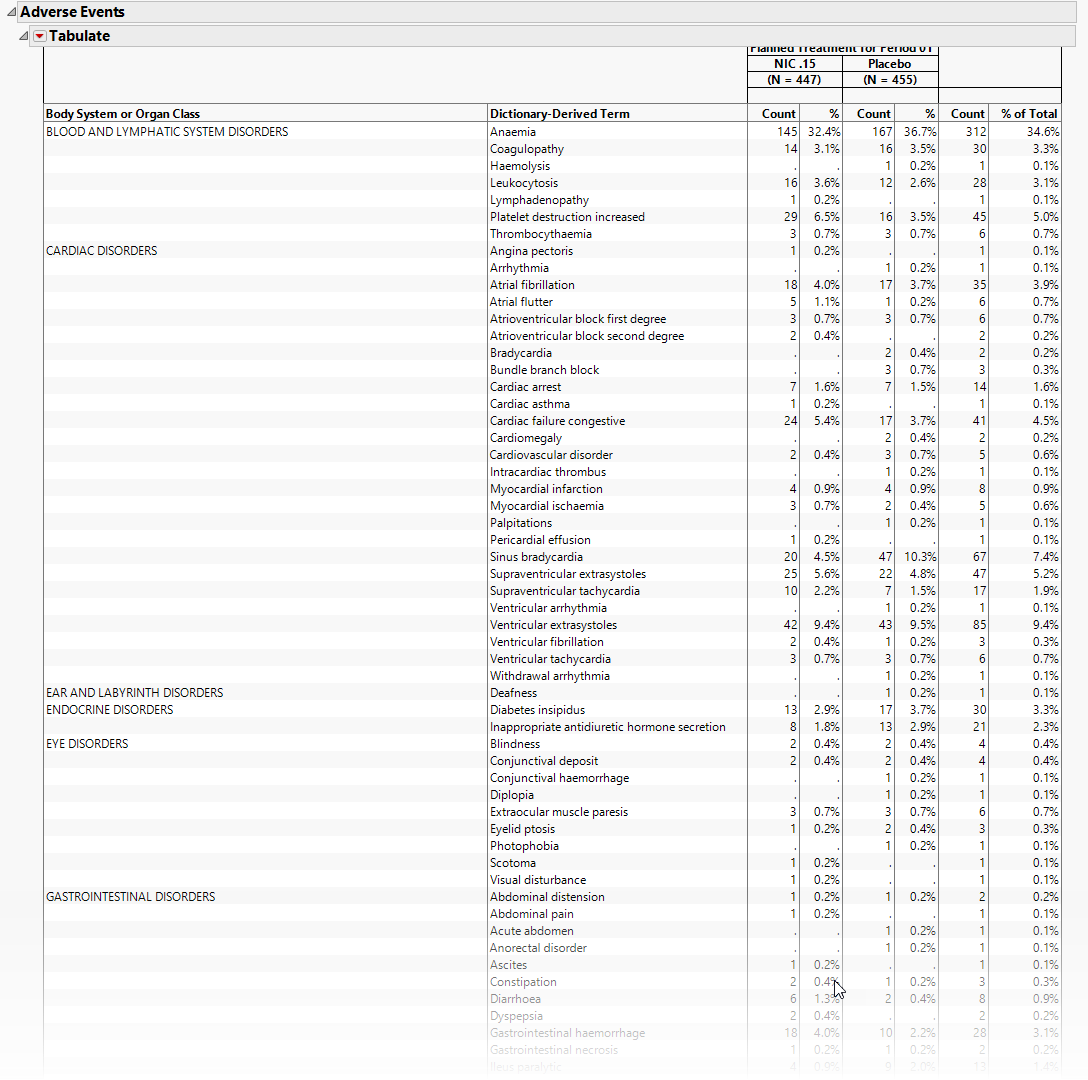
Adverse Events
The tables in this section (shown below) summarize adverse events experience by subjects in this study. Both count and percentile data are provided by treatment arm.
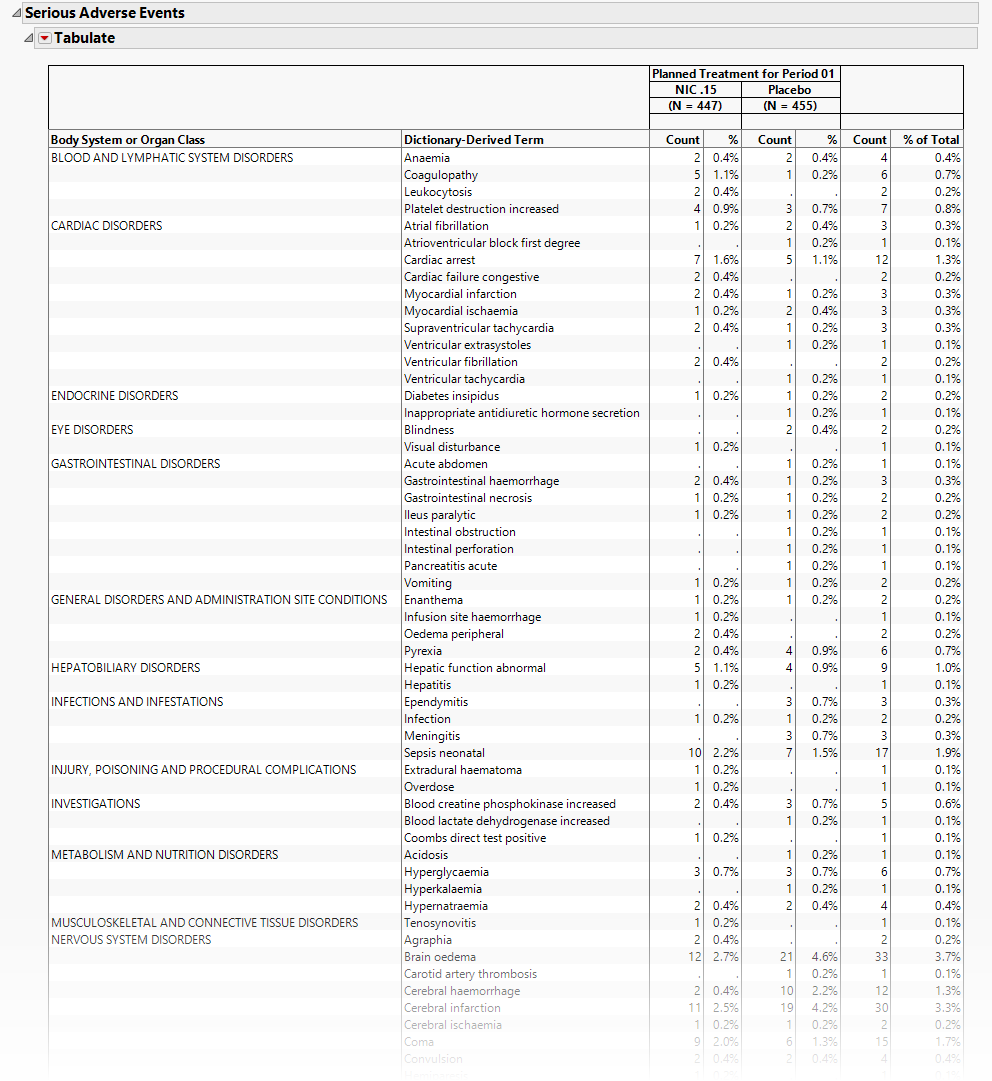
Serious Adverse Events
The tables in this section (shown below) summarize serious adverse events experience by subjects in this study. Both count and percentile data are provided by treatment arm.
Action Buttons
Action buttons, provide you with an easy way to drill down into your data. The following action buttons are generated by this report:
| • | Profile Subjects: Select subjects and click  to generate the patient profiles for subjects experiencing selected events. See Profile Subjects for additional information. to generate the patient profiles for subjects experiencing selected events. See Profile Subjects for additional information. |
| • | Show Subjects: Select subjects and click  to open the ADSL (or DM if ADSL is unavailable) of selected subjects for subjects experiencing selected events. to open the ADSL (or DM if ADSL is unavailable) of selected subjects for subjects experiencing selected events. |
| • | Adverse Events Narrative Generation: Select subjects and click  to open the Adverse Events Narrative dialog. From this dialog, you can customize options and generate a narrative. to open the Adverse Events Narrative dialog. From this dialog, you can customize options and generate a narrative. |
| • | Create Subject Filter: Select subjects and click  to create a data set of USUBJIDs for subjects experiencing selected events, which subsets all subsequently run reports to those selected subjects. The currently available filter data set can be applied by selecting Apply Subject Filter in any report dialog. to create a data set of USUBJIDs for subjects experiencing selected events, which subsets all subsequently run reports to those selected subjects. The currently available filter data set can be applied by selecting Apply Subject Filter in any report dialog. |
General
| • | Click  to view the associated data tables. Refer to View Data for more information. to view the associated data tables. Refer to View Data for more information. |
| • | Click  to generate a standardized pdf- or rtf-formatted report containing the plots and charts of selected sections. to generate a standardized pdf- or rtf-formatted report containing the plots and charts of selected sections. |
| • | Click  to generate a JMP Live report. Refer to Create Live Report for more information. to generate a JMP Live report. Refer to Create Live Report for more information. |
| • | Click  to take notes, and store them in a central location. Refer to Add Notes for more information. to take notes, and store them in a central location. Refer to Add Notes for more information. |
| • | Click  to read user-generated notes. Refer to View Notes for more information. to read user-generated notes. Refer to View Notes for more information. |
| • | Click  to open and view the Subject Explorer/Review Subject Filter. to open and view the Subject Explorer/Review Subject Filter. |
| • | Click  to specify Derived Population Flags that enable you to divided the subject population into two distinct groups based on whether they meet very specific criteria. to specify Derived Population Flags that enable you to divided the subject population into two distinct groups based on whether they meet very specific criteria. |
| • | Click the arrow to reopen the completed report dialog used to generate this output. |
| • | Click the gray border to the left of the Options tab to open a dynamic report navigator that lists all of the reports in the review. Refer to Report Navigator for more information. |
RTF/PDF Option
If you checked either of the RTF or PDF options, and RTF or PDF form of this report is also generated. This output contains the same tables shown above. In addition, if you had checked one or more of the Listings options, the RTF/PDF output contains the selected listings. Listings are not provided in the JMP Clinical output. The Subjects who Died, listing is partially shown below:
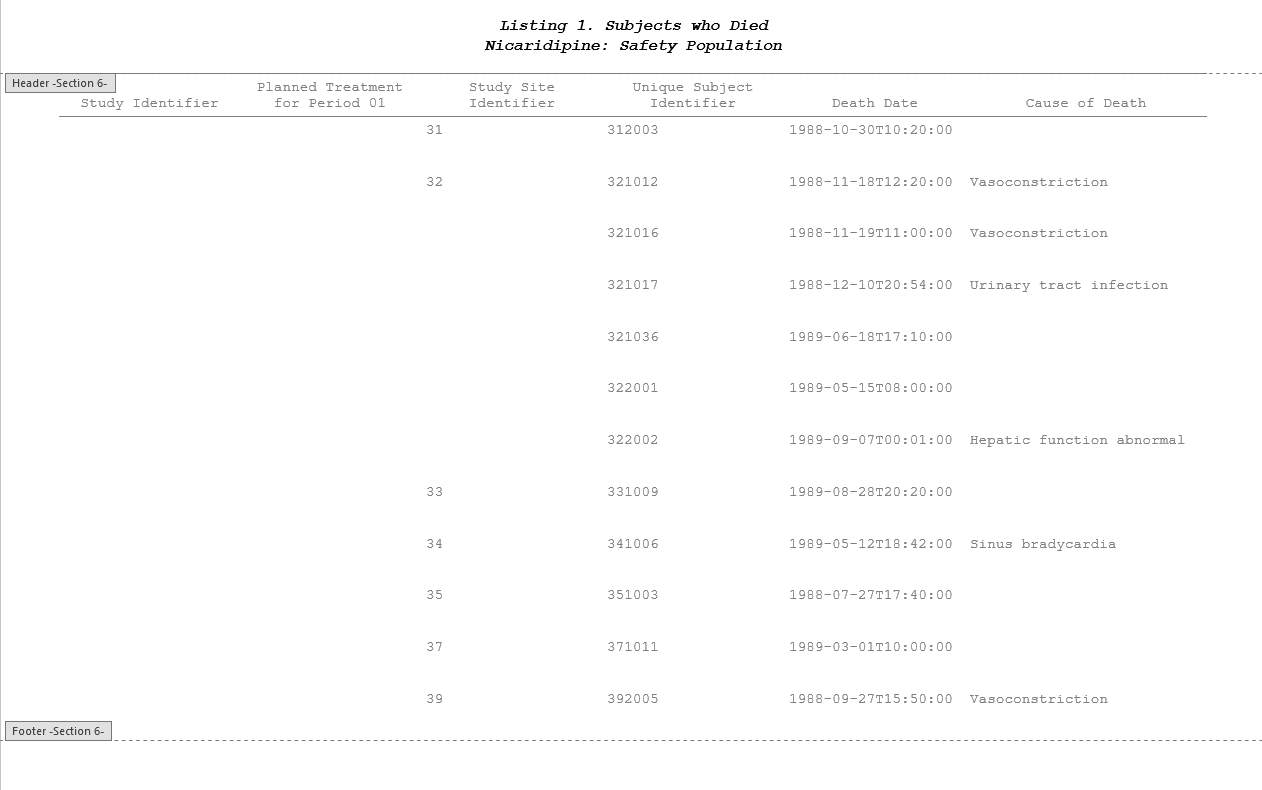
Note: An interactive Table of Contents is automatically added to both the RTF and PDF versions of the output. The PDF TOC is included in a left-side column. To view the TOC in the RTF, follow the directions given in To View the Table of Contents in Microsoft Word:
Report Options
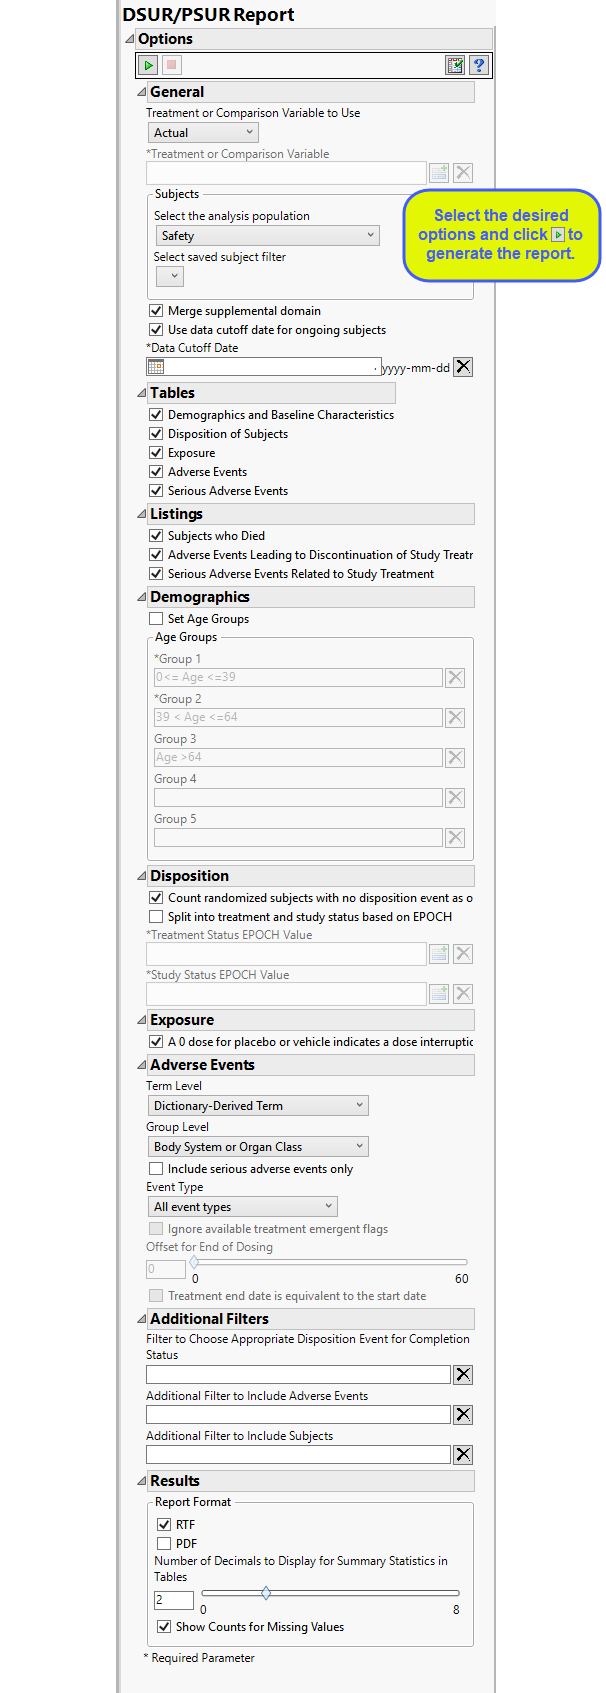
General:
The primary goal of clinical trials is to distinguish treatment effects when reporting and analyzing trial results. Treatments are defined by specific values in the treatment or comparison variables of the CDISC models. These variables are specified in this report using the Treatment or Comparison Variable to Use andTreatment or Comparison Variable options.
Distributions of the specified treatment or comparison variables are shown in the output.
Available variables include Planned, which is selected when the treatments patients received exactly match what was planned and Actual, which is selected when treatment deviates from what was planned.
You can also specify a variable other than the ARM or TRTxxP (planned treatment) or ACTARM or TRTxxA (actual treatment) from the CDISC models as a surrogate variable to serve as a comparator. Finally, you can select None to plot the data without segregating it by a treatment variable.
Filters enable you to restrict the analysis to a specific subset of subjects, based on values within variables. You can also filter based on population flags (Safety is selected by default) within the study data. See Select the analysis population, and Select saved subject filter, for more information.
If there is a supplemental domain (SUPPAE) associated with your study, you can opt to merge the non-standard data contained therein into your data. See Merge supplemental domain for more information.
For subjects who are ongoing in the study, it is useful for indicating the date on which the data for this update report was pulled, particularly when considering exposure data. The Use data cutoff date for ongoing subjects and Data Cutoff Date options enable you to specify and use a data cutoff date for reporting on ongoing subjects.
Tables and Listings
You can specify whether to include tables summarizing data regarding Demographics and Baseline Characteristics, Disposition of Subjects, Exposure, Adverse Events, and Serious Adverse Events in your report. Selected tables are included in both the report output as well as any RTF/PDF output generated by this report.
Listings are subject level tables that list Subjects who Died, subjects who were discontinued along with the Adverse Events Leading to Discontinuation of Study Treatment, and any Serious Adverse Events Related to Study Treatment.
Demographics
Setting age groups allows you to select custom ranges for grouping subjects by age in the Age Group Demographic Tables; otherwise the default grouping of 0-39, 40-64, and 65 and above is used, as shown below.
Note: You must specify non-overlapping exclusive age groups.
Note: Any subjects not falling within the specified age groups are still included in the analysis but are classified as Missing in the demographic tables.
See Set Age Groups and Group 1 for more information.
Disposition
Checking first option enables the report to Count randomized subjects with no disposition events as ongoing.
The next set of options enables you to separate disposition events by end of treatment and end of study. Check the Split into treatment and study status based on EPOCH option to enable differentiation of the subjects based on the values in EPOCH. You must then specify the values to use for the split. Use the Treatment Status EPOCH Value option to specify the value indicating that a disposition event occurred at the end of treatment. Use the Study Status EPOCH Value option to specify the value indicating that a disposition event occurred at the end of study.
Some studies will evaluate subjects at the end of treatment and then again at the end of study. So this isn’t actually about ongoing subjects. This option takes into account whether the disposition event occurred at end of treatment or end of study and splits the table into two sections.
Exposure
The A 0 dose for placebo or vehicle indicates a dose interruption option is used when a dose of 0 for either the placebo or the treatment indicates a dose interruption. This option is specified by default.
Adverse Events
Term and Group Levels are determined by the coding dictionary for the Event or Intervention domain of interest, typically these levels follow the MedDRA dictionary. You must indicate how each adverse event is named and the level at which the event is considered. For example, selecting Reported Term and Body System or Organ Class as the Term Level and Group Level, respectively, reports the event specified by the actual event term as reported in the AE domain on the affected organ or body system.
By default, all events are included in the analysis. However, you can opt to include only those considered serious. Selecting the Include serious adverse events only option restricts the analysis to those adverse events defined as Serious under FDA guidelines.
Analysis can consider all events or only those that emerge at specific times before, during, or after the trial period. For example, selecting On treatment events as the Event Type includes only those events that occur on or after the first dose of study drug and at or before the last dose of drug (+ the offset for end of dosing).
If you choose to Ignore available treatment emergent flags, the analysis includes all adverse events that occur on or after day 1 of the study.
By default, post-treatment monitoring begins after the patient receives the last treatment. However, you might want to specify an Offset for End of Dosing, increasing the time between the end of dosing and post-treatment monitoring for treatments having an extended half-life.
Check the Treatment end date is equivalent to the start date if the treatment end date (EXTENDTC) is missing from the data. In this case, it is assumed that all treatments were given on the same day and that the treatment start date can be used instead.
Additional Filters
Additional filters enable you to further restrict the analysis to a specific subset of subjects and/or adverse events, based on values within variables. The Filter to Choose Appropriate Disposition Event for Completion Status option enables you to to filter rows from the DS data set to choose the appropriate records to indicate final trial status (COMPLETED or WITHDRAWN/DISCONTINUED, for example). The Additional Filter to Include Adverse Events and Additional Filter to Include Subjects options enable you to specify additional adverse events and subjects, respectively to be included in the summary.
Results
You can use the output options to specify the format (RTF or PDF) of the final report as well as the Number of decimals to display for event percentages in tables. Finally, checking the Show Counts for Missing Values option adds a row to the summary statistic tables to report the number of missing records.