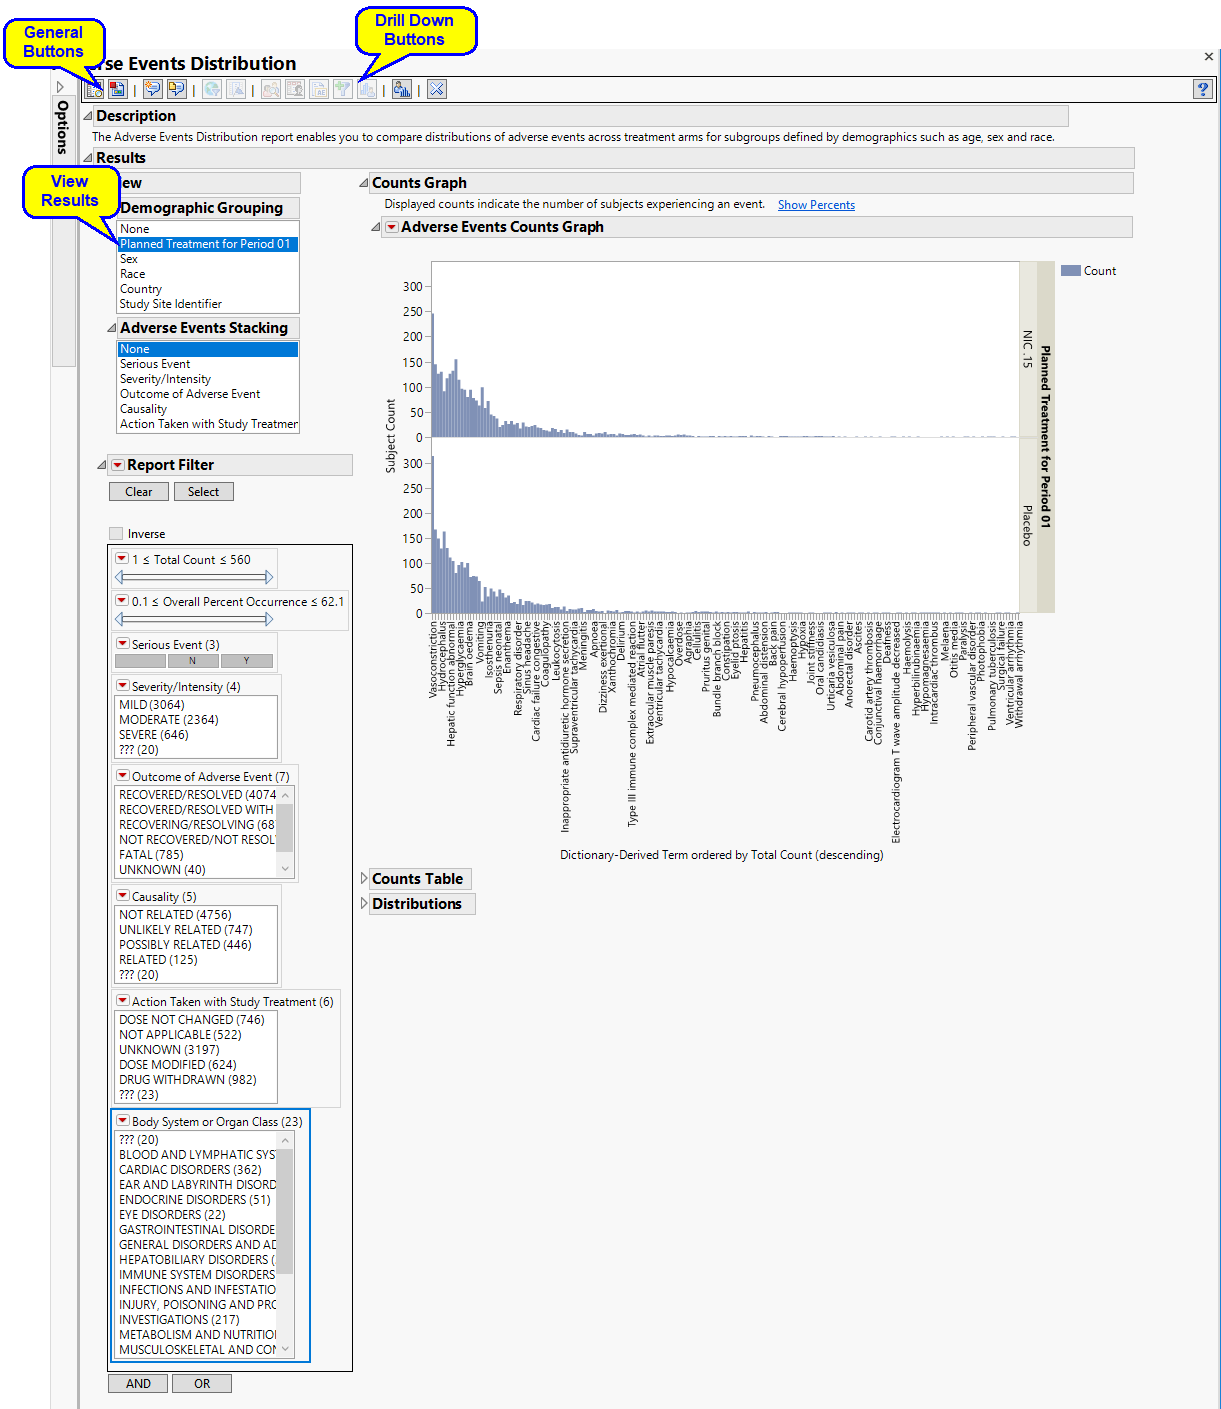
Adverse Events Distribution
This report enables you to compare distributions of adverse events across treatment arms for subgroups defined by demographics such as age, sex and race.
Note: Refer to Distribution Reports for a description of the general analysis performed by all JMP Clinical distribution reports.
Report Results Description
Running Adverse Events Distribution with Nicardipine using Actual for Treatment or Comparison Variable to Use generates the Report for Adverse Events Distribution as shown below. Differences with other reports are noted throughout this output description.
The report contains the following elements
View
| • | : Panel enables analysis of various demographic groups by selected adverse events. |
| • | : Panel enables analysis of various adverse events by selected demographic group. |
| • | Note: When AEACN = “MULTIPLE”, the same sort order chosen from the Set Value Order and Color in Studies dialog applies to all corresponding SUPPAE QNAM values where QNAM = “AEACN[…]”. |
Report Filter
This enables you to subset subjects based on demographic characteristics and other criteria. Refer to Data Filter for more information.
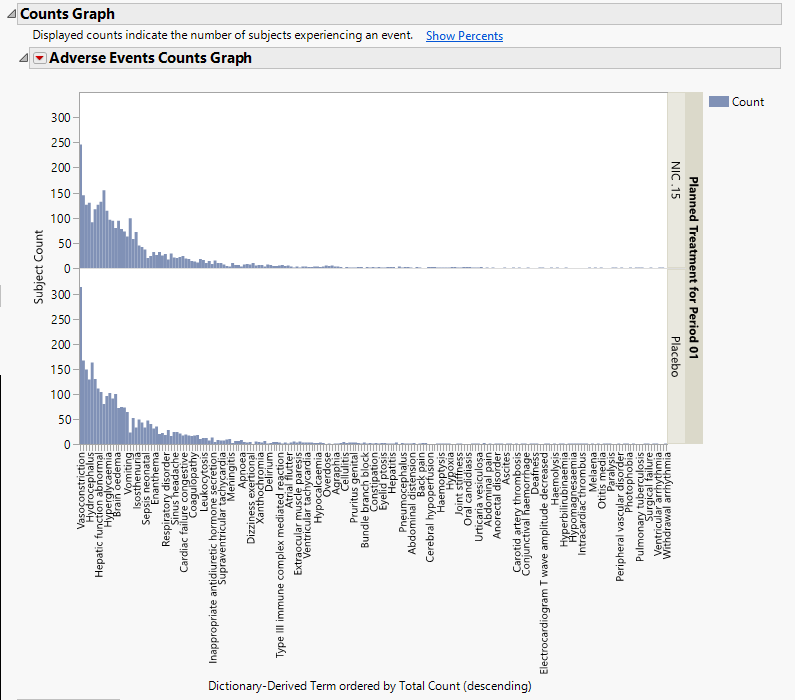
Counts Graph
Using a Bar Chart or Tree Map, this section summarizes the distributions of terms based on xxDECOD or, if unavailable, xxTERM or xxTRT depending on CDISC domain type. Results are summarized by selected demographic grouping and can be displayed either as total counts or percentages.
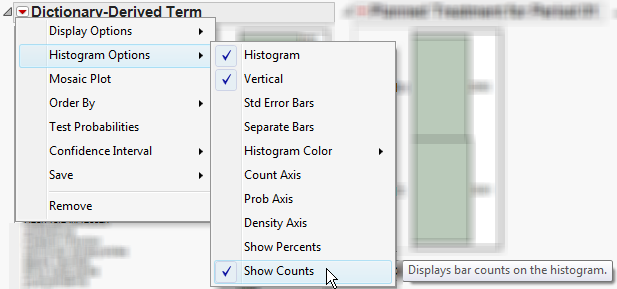
In the example shown here, Dictionary-Derived Term counts by treatment are displayed.
Counts Table
If AEBODSYS is available, a Table summarizes the distribution of Adverse events, body system or system organ class. Results are summarized by Trial Time Windows. For Interventions Distribution, xxCAT is used (if available) and the section name reflects the appropriate label. For example, for CM, the section is Category for Medication treemap.
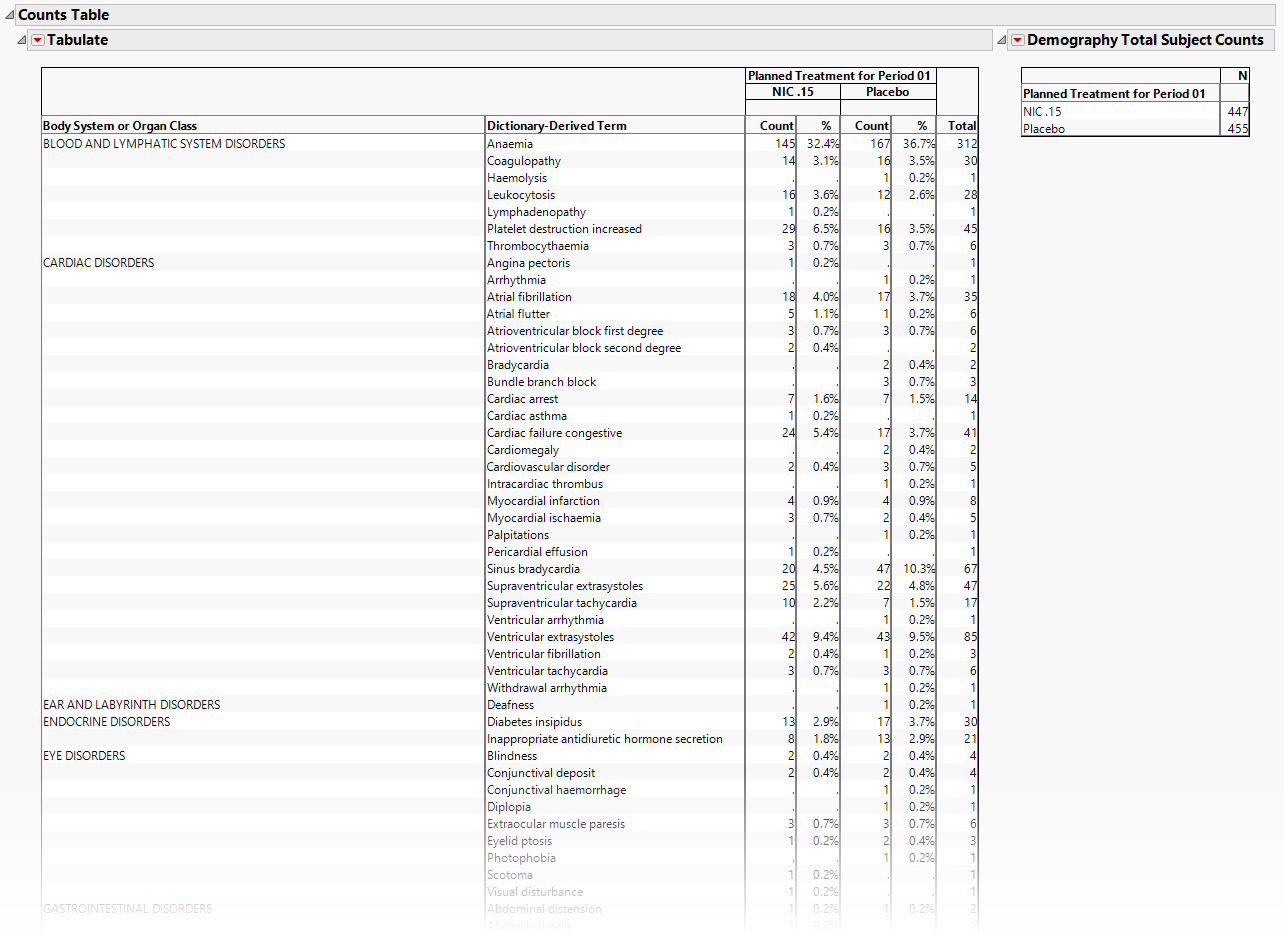
The Counts Table section contains the following element:
| • | One Table detailing the counts for each treatment group, for each dictionary-derived term within each body system or organ class. |
| • | One table listing total demography counts (as taken from DM during report generation NOT to be confused with the count of subjects experiencing events) that dynamically changes based on the Demographic Grouping column to display the denominators used in Percent calculations, described in Understanding Count and Percent Calculations. The values in this table are presented in terms of N, the counts of subjects from the demographic table regardless of event occurrence, and used as a reference for indicating how many subjects within a group experienced an event and as the denominators for percent calculations. |
Distributions
Presents Histograms of event characteristics such as Study Start Day, Causality, Outcome, Severity/Intensity, and Seriousness. Other Distribution reports present term, classification, and study day variables.
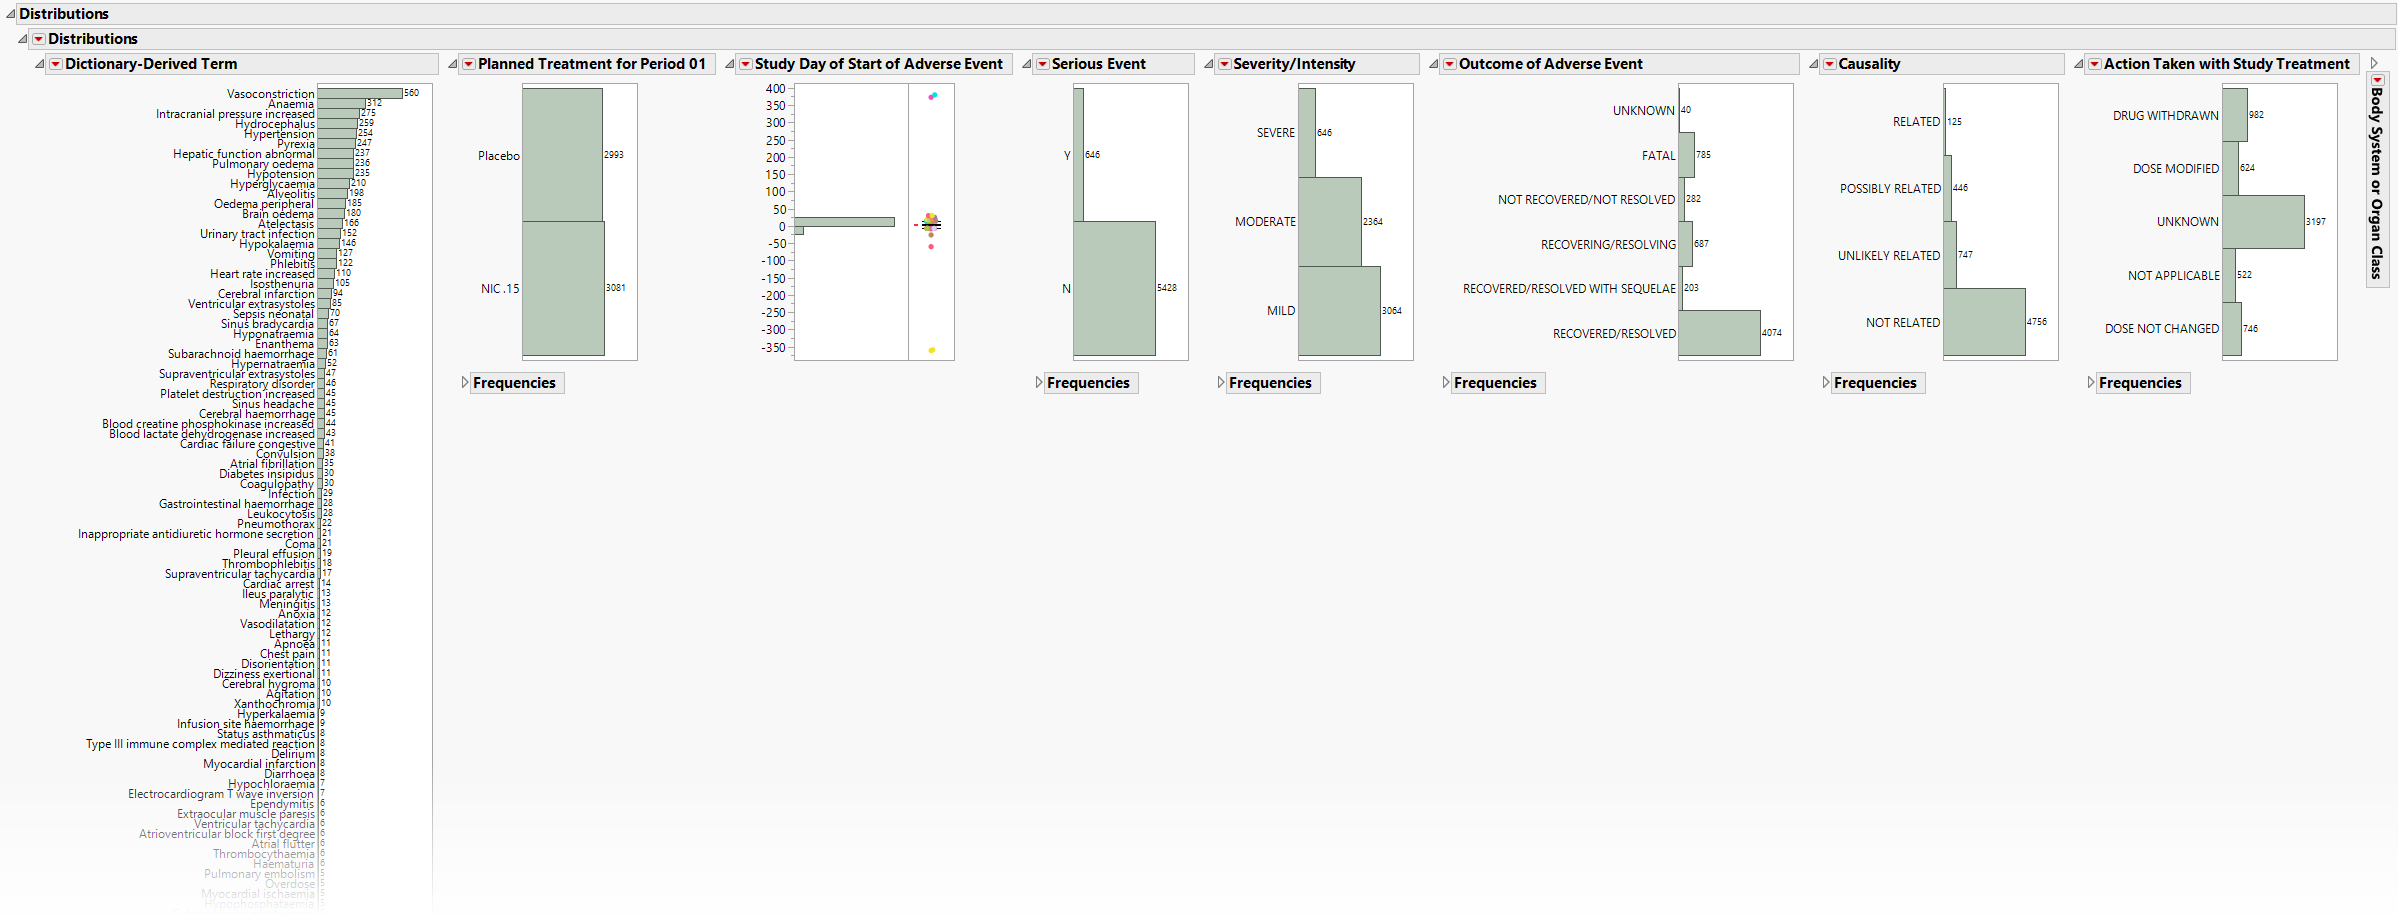
The Distributions section contains the following elements:
| • | One or more Histograms. |
The height (or length) of each bar is an indication of the number of events exhibiting such characteristics. Numbers above (or to the right of) each bar reflect a count of the number of events. Counts or percents can be added or removed using Histogram Options, which can be viewed by selecting the red triangle ( ).
).
Covariates summarized include Study Start Day, Causality, Outcome, Severity/Intensity, and Seriousness. If Count multiple occurrences of an event per subject is not checked, the event chosen is based on sorting the data by AETOXGR, seriousness (AESER), severity (AESEV, and study day (AESTDY). For Events Distribution or Interventions Distribution, the earliest of each event or intervention is presented.
See Distribution for more information.
Action Buttons
Action buttons, provide you with an easy way to drill down into your data. The following action buttons are generated by this report:
| • | Profile Subjects: Select subjects and click  to generate the patient profiles for subjects experiencing selected events. See Profile Subjects for additional information. to generate the patient profiles for subjects experiencing selected events. See Profile Subjects for additional information. |
| • | Show Subjects: Select subjects and click  to open the ADSL (or DM if ADSL is unavailable) of selected subjects for subjects experiencing selected events. to open the ADSL (or DM if ADSL is unavailable) of selected subjects for subjects experiencing selected events. |
| • | Adverse Events Narrative Generation: Select subjects and click  to open the Adverse Events Narrative dialog. From this dialog, you can customize options and generate a narrative. to open the Adverse Events Narrative dialog. From this dialog, you can customize options and generate a narrative. |
| • | Create Subject Filter: Select subjects and click  to create a data set of USUBJIDs for subjects experiencing selected events, which subsets all subsequently run reports to those selected subjects. The currently available filter data set can be applied by selecting Apply Subject Filter in any report dialog. to create a data set of USUBJIDs for subjects experiencing selected events, which subsets all subsequently run reports to those selected subjects. The currently available filter data set can be applied by selecting Apply Subject Filter in any report dialog. |
| • | Demographic Counts: Select subjects and click  to generate a set of Histograms showing demographics of the selected subjects. to generate a set of Histograms showing demographics of the selected subjects. |
| • | Unique Occurrence Subject Counts: Select individual records and click  consider the selected/filtered adverse events records only and take the FIRST OCCURRENCE for each subject per each adverse event. consider the selected/filtered adverse events records only and take the FIRST OCCURRENCE for each subject per each adverse event. |
General
| • | Click  to view the associated data tables. Refer to View Data for more information. to view the associated data tables. Refer to View Data for more information. |
| • | Click  to generate a standardized pdf- or rtf-formatted report containing the plots and charts of selected sections. to generate a standardized pdf- or rtf-formatted report containing the plots and charts of selected sections. |
| • | Click  to generate a JMP Live report. Refer to Create Live Report for more information. to generate a JMP Live report. Refer to Create Live Report for more information. |
| • | Click  to take notes, and store them in a central location. Refer to Add Notes for more information. to take notes, and store them in a central location. Refer to Add Notes for more information. |
| • | Click  to read user-generated notes. Refer to View Notes for more information. to read user-generated notes. Refer to View Notes for more information. |
| • | Click  to open and view the Subject Explorer/Review Subject Filter. to open and view the Subject Explorer/Review Subject Filter. |
| • | Click  to specify Derived Population Flags that enable you to divided the subject population into two distinct groups based on whether they meet very specific criteria. to specify Derived Population Flags that enable you to divided the subject population into two distinct groups based on whether they meet very specific criteria. |
| • | Click the arrow to reopen the completed report dialog used to generate this output. |
| • | Click the gray border to the left of the Options tab to open a dynamic report navigator that lists all of the reports in the review. Refer to Report Navigator for more information. |
Note: For information about how treatment emergent adverse events (TEAEs) are defined in JMP Clinical, please refer to How does JMP Clinical determine whether an Event Is a Treatment Emergent Adverse Event?.
Note: The following notes: Multiple treatment periods have been detected and displayed. and Pre-treatment has been assigned to period=0. are inserted at the top of the report when these events are detected in your data.
Report Options

Term and Group Levels
Term and Group Levels are determined by the coding dictionary for the Event or Intervention domain of interest, typically these levels follow the MedDRA dictionary. You must indicate how each adverse event is named and the level at which the event is considered. For example, selecting Reported Term and Body System or Organ Class as the Term Level and Group Level, respectively, reports the event specified by the actual event term as reported in the AE domain on the affected organ or body system.
Treatment or Comparison Variable:
The primary goal of clinical trials is to distinguish treatment effects when reporting and analyzing trial results. Treatments are defined by specific values in the treatment or comparison variables of the CDISC models. These variables are specified in this report using the Treatment or Comparison Variable to Use andTreatment or Comparison Variable options.
Distributions of the specified treatment or comparison variables are shown in the output.
Available variables include Planned, which is selected when the treatments patients received exactly match what was planned and Actual, which is selected when treatment deviates from what was planned.
You can also specify a variable other than the ARM or TRTxxP (planned treatment) or ACTARM or TRTxxA (actual treatment) from the CDISC models as a surrogate variable to serve as a comparator. Finally you can select None to plot the data without segregating it by a treatment variable.
See Treatment or Comparison Variable to Use, Treatment or Comparison Variable for more information.
Events to Consider
By default, all events are included in the analysis. However, you can opt to include only those considered serious. Selecting the Include serious adverse events only option restricts the analysis to those adverse events defined as Serious under FDA guidelines.
Analysis can consider all events or only those that emerge at specific times before, during, or after the trial period. For example, selecting On treatment events as the Event Type includes only those events that occur on or after the first dose of study drug and at or before the last dose of drug (+ the offset for end of dosing).
If you choose to Ignore available treatment emergent flags, the analysis includes all adverse events that occur on or after day 1 of the study.
By default, post-treatment monitoring begins after the patient receives the last treatment. However, you might want to specify an Offset for End of Dosing, increasing the time between the end of dosing and post-treatment monitoring for treatments having an extended half-life.
Check the Treatment end date is equivalent to the start date if the treatment end date (EXTENDTC) is missing from the data. In this case, it is assumed that all treatments were given on the same day and that the treatment start date can be used instead.
By default, the number of occurrences of an adverse event is computed as the number of subjects experiencing that effect, regardless of how many times each subject experienced the effect. When a patient experiences multiple occurrences of an event, the software selects the occurrence for analysis based first on whether it is a serious event, then by severity and finally by time. When the Count multiple occurrences of an event per subject check box is checked, the counts reported for each event represent the total of all the occurrences of that event.
Use the Include events with overall percent occurrence greater than option to specify a threshold that enables you to consider only those events that exceed that threshold, in terms of overall percent of occurrence, and exclude those events that do not.
Use the Include events with percent occurrence in any treatment group greater than option to specify a threshold that enables you to consider only those events that exceed that threshold, in any treatment group, in terms of overall percent of occurrence, and exclude those events that do not.
The Calculate Relative Risks to compare incidence in treatment groups versus a control and Treatment Control Level options are used in conjunction to compute the relative risk of experiencing each adverse event for those subjects receiving the experimental treatment compared to the specified control group.
Incidence Rates
The options in this section enable you to report events that occurred only within a specified time at risk period. A new column named "IR" is inserted into the table representing the incidence rates for each adverse event. Additionally the counts graph can be changed to show Incidence Rates instead of counts.
Choosing these options imposes specific filtering restrictions on the adverse event record data. When selected, only adverse events that occur within the defined study or treatment duration variable will be included in the resulting report (e.g. pre and post treatment recorded adverse events are dropped). If any of the subjects in the study are missing either start date or end date values (as defined by the Time at Risk selection) and the time at risk is determined from date variables, then those subjects and their related adverse event records are dropped from the analysis as rates cannot be accurately computed without a duration computation for each subject contributing to overall patient years. If this happens, the report output will include a note explaining how many subjects were dropped from the event analysis.
You must first check the Calculate Incidence Rates for adverse event occurrences option in this section to compute the rate of occurrence in patient years for adverse events whose occurrence starts within a specified time at risk period. You must also choose your type of Time at Risk: and a Patient Years Multiplier: and select either Determine Time at Risk and Adverse Event inclusion from:dates available in the DM or ADSL data (representing either treatment start/end or study start/end) or based on derived time (Specify pre-computed variable of time at risk in patient days) and flag variables ( Specify flag variable to include events that occurred in time at risk periodn the DM/ADSL data sets (for each patient's time at risk) and an inclusion flag (if the AE record should be considered in the rate calculation). If you choose to Determine Time at Risk and Adverse Event inclusion from:date variable you can also specify an Offset (in Days) to Include with End Date Variable or Use last modification date for ongoing subjects.
Filtering the Data:
Filters enable you to restrict the analysis to a specific subset of subjects and events based on values within variables. You can also filter based on population flags (Safety is selected by default) within the study data.
If there is a supplemental domain (SUPPAE) associated with your study, you can opt to merge the non-standard data contained therein into your data.
See Select the analysis population, Select saved subject filter1, Merge supplemental domain, Include the following adverse events:, Additional Filter to Include Adverse Events, Additional Filter to Include Subjects.
Results
You can opt to Sort adverse events table by: either natural order or counts.
Use the Variables to include in Report Filter option to specify the variables to be included in the report data filter.
You can also subdivide the subjects and run analyses for distinct groups by specifying one or more By Variables.